
OCR Specification focus:
‘Evaluate results and draw conclusions, considering how the scientific community validates new knowledge and maintains integrity.’
Evaluating results and drawing conclusions are vital skills in physics experiments. They ensure that findings are valid, reliable, and consistent with accepted scientific understanding through rigorous analysis and peer validation.
Understanding Evaluation in Experimental Physics
Evaluation involves critically analysing data to judge how well the experiment supports or contradicts the hypothesis. It goes beyond numerical processing to consider accuracy, precision, uncertainty, and scientific reasoning. A physicist must interpret data in context, question limitations, and judge whether conclusions are supported by empirical evidence.
Reliability and Validity
Reliability describes how consistently results can be reproduced under the same conditions, while validity reflects whether the experiment truly measures what it intends to measure. Both are essential in drawing credible conclusions.
Reliability: The degree to which repeated measurements under unchanged conditions show the same results.
Validity: The extent to which experimental results accurately represent the investigated physical quantity or relationship.
Reliability can be improved by repetition and consistent methodology, whereas validity depends on correct experimental design and control of variables.
Drawing Scientific Conclusions
Drawing conclusions requires linking processed data back to the original aim or hypothesis. A valid conclusion:
Directly relates to the experimental question or hypothesis.
Is justified with quantitative data, such as mean values, gradients, or derived physical constants.
Considers uncertainties and their impact on result confidence.
Uses correct scientific reasoning to explain why results support or contradict theoretical expectations.
Students should use evidence-based statements such as:
“The data supports the hypothesis because…”
“The result deviates due to systematic uncertainty in…”
Correlation, Causation, and Data Trends
Physics conclusions often depend on identifying relationships between variables. Recognising the distinction between correlation and causation prevents overinterpretation.
Correlation: A statistical relationship between two variables that does not necessarily imply one causes the other.
When plotting graphs, clear trends (e.g., linear, exponential, inverse-square) can indicate a potential causal link, but only if experimental design eliminates confounding variables and theoretical backing exists.
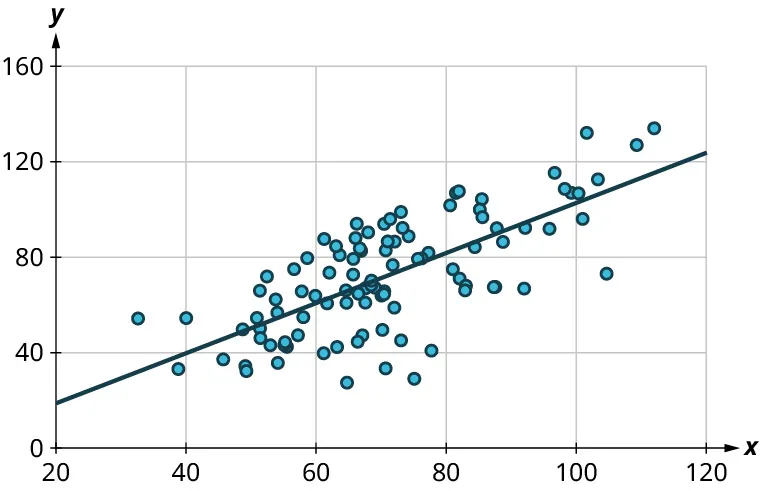
A scatter plot with a straight line of best fit demonstrating how patterns are used to infer relationships between variables. It reinforces that conclusions must be data-led and framed with uncertainty. Note: this figure emphasises trend identification; it does not include error bars, which should be added in your own graphs when appropriate. Source.
Evaluating the Quality of Results
High-quality evaluation involves questioning how trustworthy the results are and what affects their dependability.

A labelled diagram contrasting high and low accuracy with high and low precision using target patterns. It visually separates closeness to the true value (accuracy) from repeatability of measurements (precision), directly supporting data-quality evaluation. Source.
Key aspects to consider include:
Consistency: Are the data points close to the mean or line of best fit?
Accuracy: Are results close to the accepted or theoretical value?
Precision: Are repeated measurements close together?
Reproducibility: Can other researchers achieve similar results?
EQUATION
—-----------------------------------------------------------------
Percentage Error (%) = (|Experimental value − Accepted value| / Accepted value) × 100
Experimental value = Measured result from experiment (varies by quantity and unit)
Accepted value = Widely agreed theoretical or literature value (varies by quantity and unit)
—-----------------------------------------------------------------
Small percentage errors indicate high accuracy, while large errors suggest methodological or instrumental limitations.
Sources of Error and Uncertainty
Errors and uncertainties influence how results are interpreted. Evaluating them helps determine confidence in conclusions.
Random errors cause unpredictable fluctuations, reduced by averaging multiple readings.
Systematic errors shift all measurements in one direction due to faulty calibration or bias.
Zero errors and parallax errors are common examples requiring correction or acknowledgment.
When drawing conclusions, state the overall uncertainty range and its potential effect on validity. For instance, “The acceleration due to gravity was found to be 9.5 ± 0.2 m/s², within 3% of the accepted value.”
Evaluating Against Theoretical Models
A complete evaluation compares results to theoretical predictions or known physical laws. Discrepancies may arise from limitations in apparatus, external conditions, or simplifying assumptions. When significant differences appear, they must be explored logically, not dismissed.
For example:
Deviations from linear motion laws may be due to air resistance.
Variations in resistivity values could arise from temperature effects.
Evaluating Data Integrity
Integrity in scientific evaluation demands honesty and objectivity. Data should never be altered to fit a hypothesis. Outliers must be examined rather than excluded without justification. Ethical evaluation ensures results can withstand peer scrutiny.
Scientific Integrity: The commitment to truthfulness, transparency, and ethical responsibility in the collection, analysis, and reporting of data.
The Role of the Scientific Community
Scientific knowledge gains credibility through peer review, repetition, and collaborative validation. Individual findings must be scrutinised, reproduced, and verified by others before acceptance.
Key processes include:
Publication in peer-reviewed journals for external assessment.
Replication of experiments by independent groups.
Consensus formation through consistent results across studies.
This process ensures that physics conclusions are not just personal interpretations but part of a collective evidence base supporting reliable knowledge.
Improving Confidence in Conclusions
To strengthen the validity of conclusions:
Increase sample size and repeat trials.
Use more precise apparatus with smaller uncertainty margins.
Control environmental variables such as temperature or humidity.
Calibrate instruments before and after use.
Apply mathematical and statistical tests (e.g., error propagation, linear regression) for rigorous evaluation.
Each improvement reduces uncertainty and enhances confidence in the final statement of results.
Communicating Evaluations
Clear communication ensures results can be understood and trusted. In written reports:
Present results in context of the aim and theory.
State whether the hypothesis is supported or refuted.
Discuss errors and how they affect reliability.
Suggest future improvements or further investigation to resolve discrepancies.
This structured evaluation process demonstrates the integration of data analysis, critical thinking, and scientific integrity, aligning with OCR’s requirement to evaluate results and draw conclusions in line with community validation standards.
Practice Questions
Question 1 (2 marks)
A student measures the time period of a simple pendulum to determine the acceleration due to gravity. After several trials, the student concludes that the result is “accurate and reliable.”
Explain what is meant by the terms accurate and reliable in this context.
Mark scheme:
1 mark for stating that accurate means the result is close to the accepted or true value of the acceleration due to gravity.
1 mark for stating that reliable means the result is consistent or repeatable when the experiment is repeated under the same conditions.
Question 2 (5 marks)
A student investigates the relationship between current and potential difference for a filament lamp. The plotted graph shows a curve that flattens at higher voltages.
(a) Explain how the student could evaluate the results and determine whether they are valid and reliable. (3 marks)
(b) Discuss how the student’s conclusions might be affected by the presence of systematic or random errors in the experiment. (2 marks)
Mark scheme:
(a)
1 mark for comparing the shape of the experimental graph with the theoretical prediction (non-linear due to increasing resistance with temperature).
1 mark for suggesting repeating measurements or taking averages to improve reliability.
1 mark for commenting on the control of variables (e.g. using the same filament lamp, ensuring temperature changes are considered) to support validity.
(b)
1 mark for stating that systematic errors (e.g. incorrectly calibrated voltmeter) would shift all readings in one direction, affecting accuracy and potentially leading to incorrect conclusions.
1 mark for stating that random errors cause scatter around the curve, making the data less precise and reducing confidence in the drawn conclusion.
FAQ
Interpreting results focuses on identifying patterns, relationships, and outcomes from collected data — essentially explaining what the data shows.
Evaluating results goes further: it judges the quality, reliability, and validity of the data and methods used. Evaluation also involves considering errors, uncertainties, and whether the results truly support the hypothesis or align with theoretical predictions.
Bias occurs when a systematic influence skews results or their interpretation, often unconsciously. It can arise from:
Selecting data that supports expectations while ignoring contradictory results.
Using uncalibrated equipment that consistently over- or under-measures.
Misinterpreting trends to fit theoretical expectations.
Recognising and minimising bias by maintaining objectivity and transparency strengthens the integrity of conclusions.
Peer review ensures scientific credibility by allowing independent experts to evaluate the methodology, analysis, and reasoning behind conclusions.
Through this process:
Flaws or unjustified assumptions are identified.
Data interpretation is verified against accepted principles.
Replication and further testing are encouraged.
This community scrutiny ensures that new findings contribute reliably to the broader body of scientific knowledge.
Outliers are data points that differ markedly from the rest of the results. They can:
Indicate experimental errors, such as faulty equipment or incorrect readings.
Reveal genuine anomalies, suggesting new physical effects or uncontrolled variables.
Rather than automatically discarding outliers, students should analyse their cause. If justified, they may exclude them with explanation; otherwise, they form part of the discussion on data variation.
When data diverges from theory, an informed conclusion should explore why. Students should:
Re-examine assumptions or simplifications made in the theoretical model.
Identify potential systematic errors or uncontrolled variables.
Suggest refinements to apparatus, measurement technique, or data range.
A strong conclusion acknowledges discrepancies honestly and proposes logical next steps rather than forcing agreement with theory.
