
AP Syllabus focus:
‘Extend the concept of a limit to include infinite limits, describing situations where function values grow without bound as x approaches a specific number.’
Infinite limits describe how functions behave when their values grow without bound near specific inputs, helping us understand extreme behavior and recognize unbounded tendencies essential in calculus.
Understanding Infinite Limits
When studying limits in calculus, the idea of a limit expands beyond approaching a finite number. In some situations, a function’s values become arbitrarily large in the positive or negative direction as the input approaches a particular number. This behavior motivates the concept of an infinite limit, which allows us to describe unbounded function behavior precisely and consistently using limit notation.
What “Unbounded Behavior” Means
Unbounded behavior occurs when a function’s output increases or decreases without any finite bound as the input nears a given value. In these situations, the function does not settle near any real number; instead, its values grow indefinitely. Understanding this concept requires recognizing that the limit does not represent a numerical height the function reaches but the trend of its behavior.
Infinite Limit: A limit in which the values of a function increase or decrease without bound as the input approaches a particular number.
A function exhibiting unbounded behavior near an input demonstrates a trend rather than a specific output, emphasizing that limits describe approach, not attainment.
Formal Notation for Infinite Limits
Limit notation for infinite limits communicates that a function’s values grow too large to approach a finite real number. This notation helps distinguish between finite limit behavior and unbounded behavior.
Reading Limit Notation for Unbounded Growth
Expressions such as
tell us how the function behaves as gets arbitrarily close to a specific value .
: A symbol indicating that values increase without bound. It does not represent a real number.
These statements do not claim that the function ever reaches infinity; instead, they describe the function’s unbounded trend as inputs approach .
How Infinite Limits Relate to Graphs
Graphs play a central role in visualizing infinite limits. When a function’s values grow without bound near a specific -value, the graph often exhibits a steep climb or drop. The function’s curve stretches upward or downward increasingly sharply as it nears the critical input.
Recognizing Unbounded Behavior Visually
A student analyzing a graph should look for:
A vertical direction of growth (high or low) near a specific -value.
Increasingly steep slopes approaching that input.
Function values trending beyond any visible scale on the graph.
Such visual cues reinforce the concept that infinite limits describe a lack of finite approach, distinguishing them from discontinuities where finite limits exist.
Graphically, an infinite limit means the graph of f shoots upward or downward without bound as x approaches a specific finite value, often near a vertical line.
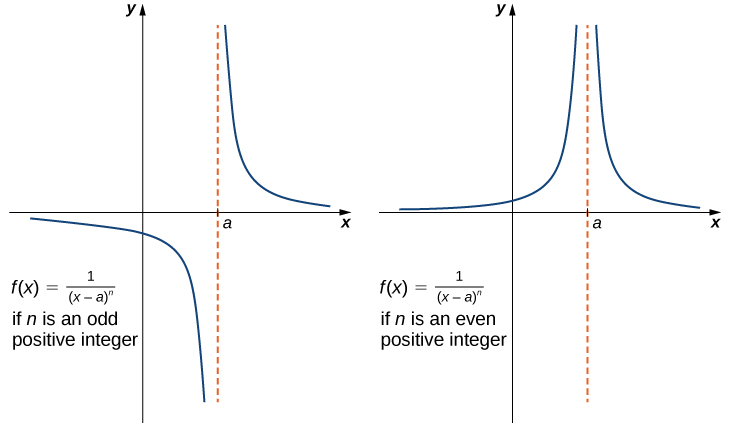
Graphs of illustrating infinite limits at . When is even, values approach from both sides. When is odd, the function tends to on one side and on the other, demonstrating directional dependence of infinite limits. Source.
One-Sided Infinite Limits
Sometimes a function grows without bound on only one side of a particular input. One-sided limit notation helps communicate this directional behavior clearly.
Left-Hand and Right-Hand Infinite Limits
One-sided infinite limits use symbols such as or to indicate the direction of approach.
Examples of notation students may see include:
These statements reveal directional trends, which may differ depending on how the function behaves from each side. Recognizing directionality is essential for understanding when full two-sided infinite limits exist and when the behavior diverges on opposite sides.
Infinite Limits and Vertical Asymptotes
Infinite limits often correspond to special graph features that signal dramatic changes in function behavior. One such feature is the vertical asymptote, a vertical line the graph approaches but never touches.
Vertical Asymptote: A vertical line such that the function’s values increase or decrease without bound as approaches .
A vertical asymptote represents a geometric interpretation of an infinite limit, giving students a structural framework to connect repeated patterns of unbounded behavior to limit notation.
A function does not need to have the same unbounded direction on both sides of a vertical asymptote. The function might approach from one side and from the other, reinforcing the idea that infinite limits are directional descriptions rather than fixed outcomes.
The vertical line x = c is called a vertical asymptote when the values of f(x) grow without bound (positive or negative) as x approaches c.
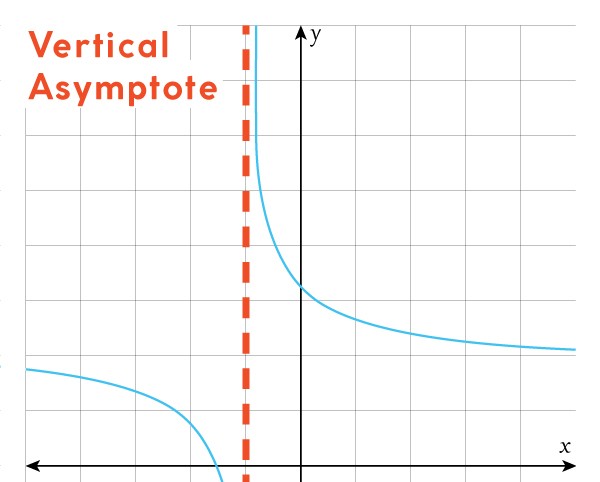
A graph showing a function approaching a dashed vertical line at . The curve tends to on one side and on the other, illustrating one-sided infinite limits. This highlights how vertical asymptotes represent unbounded behavior rather than actual function values. Source.
Identifying Infinite Limits in Context
When interpreting contextual or applied scenarios, infinite limits describe situations where a quantity modeled by a function escalates without bound as the input nears a certain constraint. This interpretation allows students to use infinite limits not only as formal mathematical tools but also as conceptual frameworks for modeling extreme or boundary behaviors.
Key Indicators of an Infinite Limit
Students should watch for:
Denominators approaching zero while numerators remain nonzero, producing rapid growth.
Graphs stretching upward or downward near specific -values.
Descriptions of values increasing or decreasing without any upper or lower limit.
Understanding these indicators sharpens analytical skills and deepens comprehension of how infinite limits formalize unbounded function behavior.
Using Infinite Limit Notation to Describe Behavior
Precise notation helps communicate mathematical reasoning clearly. Infinite limit notation becomes a powerful language tool that indicates the function’s behavior rather than its output. Students must emphasize the distinction between describing what a function does near a point and identifying what value it has at a point.
Importance of Interpreting Notation Correctly
Limit statements involving infinity describe trends, not fixed values. They help articulate the idea that the function moves beyond any real number as approaches a specific input, fulfilling the syllabus requirement to describe unbounded behavior using formal limit concepts.
Practice Questions
Question 1 (1–3 marks)
The graph of a function f shows that as x approaches 2 from both sides, the values of f decrease without bound.
a) State the value of the limit of f(x) as x approaches 2. (1 mark)
b) Explain briefly what this limit tells you about the behaviour of the graph near x = 2. (1–2 marks)
Question 1
a) Award 1 mark for:
• Correct statement: limit is -infinity.
b) Award up to 2 marks:
• 1 mark for stating that the function decreases without bound or falls indefinitely.
• 1 mark for noting that the graph descends steeply or approaches a vertical asymptote at x = 2.
Question 2 (4–6 marks)
Consider the function g(x) = 1 / (x + 3).
a) Determine the limit of g(x) as x approaches -3 from the right. Justify your answer using the sign of the denominator. (2–3 marks)
b) Determine the limit of g(x) as x approaches -3 from the left. Explain your reasoning clearly. (2–3 marks)
c) Hence describe the behaviour of the graph of g near x = -3, stating whether a vertical asymptote exists. (1 mark)
Question 2
a) Award 2–3 marks:
• 1 mark for identifying the denominator approaches 0 through positive values when approaching -3 from the right.
• 1–2 marks for concluding that the function tends to +infinity.
b) Award 2–3 marks:
• 1 mark for identifying the denominator approaches 0 through negative values when approaching -3 from the left.
• 1–2 marks for concluding that the function tends to -infinity.
c) Award 1 mark for:
• Correctly stating that x = -3 is a vertical asymptote of the graph of g.
FAQ
An infinite limit describes unbounded behaviour: the function grows without bound in the positive or negative direction as x approaches a specific value.
A limit can also fail to exist for other reasons, such as oscillation or differing finite left- and right-hand limits.
In those cases, the function does not approach any single trend, whereas an infinite limit still has a clear directional trend, even though it is unbounded.
Yes. A function may have an infinite limit at x = c even if a finite value is assigned at that point.
The unbounded behaviour comes from values arbitrarily close to c, not from f(c) itself.
Such points are discontinuous, because the function value cannot match an infinite limit.
Check the sign of the expression controlling growth as x approaches the critical value.
Useful steps include:
• Identify the term that becomes zero in the denominator or drives unbounded behaviour.
• Determine the sign of the numerator.
• Evaluate the sign of each side as x approaches the point.
The sign analysis reveals whether the output rises to positive infinity or falls to negative infinity.
No. Many functions have asymmetric behaviour.
A function can rise to positive infinity from one side and fall to negative infinity from the other.
This depends on how the expression changes sign as x crosses the critical value.
Only when both sides share the same tendency do we describe the two-sided infinite limit as infinite in one direction.
Yes. The rate at which a function diverges can differ on each side of the point.
This does not affect the existence of the infinite limit, because infinite limits describe trend rather than speed.
However, the graph may appear steeper on one side, reflecting a faster approach to unbounded values.
