
AP Syllabus focus:
‘Solve problems that require combining information from more than one representation of a function, such as using a graph and a table together to support a limit conclusion.’
This subsubtopic focuses on interpreting limits by synthesizing graphical, numerical, and analytic information, strengthening conceptual understanding and improving accuracy when a single representation may be misleading or incomplete.
Multi-Representation Limit Problems
Multi-representation limit problems require students to coordinate information from graphs, tables, and analytic expressions to determine how a function behaves near a specific point. Because each representation highlights different aspects of a function’s behavior, skillfully combining them offers stronger justification and greater reliability when evaluating limits.
Understanding the Role of Each Representation
Graphical Representation
A graphical representation displays the visual behavior of a function near a target value.
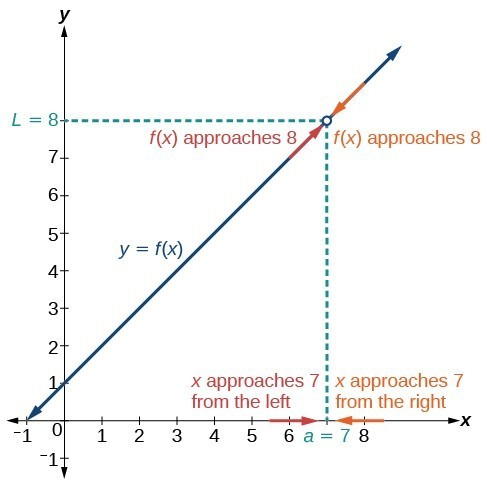
The graph shows y=x+1y=x+1y=x+1 approaching the value 8 as xxx approaches 7 from both sides, illustrating that the limit exists even though the function is not defined at that point. Source.
Graphs reveal patterns such as approaching values, jumps, oscillations, or asymptotes, even when formulas or tables are cumbersome.
Graphical Limit: The value a graph appears to approach as gets arbitrarily close to a point, considering both left- and right-hand behavior.
Graphs may obscure details if the scale is coarse or key features lie between plotted points, so they should be cross-checked with numerical and analytic information.
Numerical Representation
A table of values offers discrete numerical evidence of a function’s behavior by showing outputs for inputs approaching the point of interest from one or both sides.
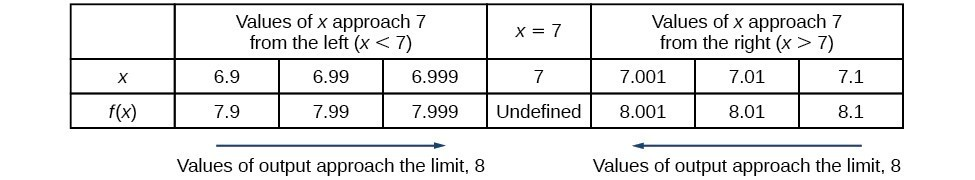
The table shows values of f(x)=x+1f(x)=x+1f(x)=x+1 approaching 8 from both sides as xxx approaches 7, demonstrating how numerical patterns support a two-sided limit even if the function is undefined at that point. Source.
Tables can clarify subtle local patterns invisible on a graph.
Numerical Limit: A value suggested by a pattern in function values as inputs approach a target number from the left and the right.
Although tables provide precision, they never capture infinitely many points, so they must be interpreted cautiously and supported by other forms of evidence.
Analytic Representation
An analytic expression, such as a formula, gives direct insight into algebraic structure, domain restrictions, and opportunities for simplification. Analytic reasoning can verify whether behaviors seen in graphs and tables are consistent with the function’s algebra.
EQUATION
= input approaching the target value
= the limiting value approached by the function
Analytic evaluations are often the most conclusive but sometimes require support from other representations, especially when the expression is piecewise, undefined at a point, or prone to indeterminate forms.
Why Multi-Representation Analysis Matters
Reinforcing Conceptual Understanding
Using several forms simultaneously emphasizes that a limit concerns nearby behavior, not necessarily the value of the function at the point.
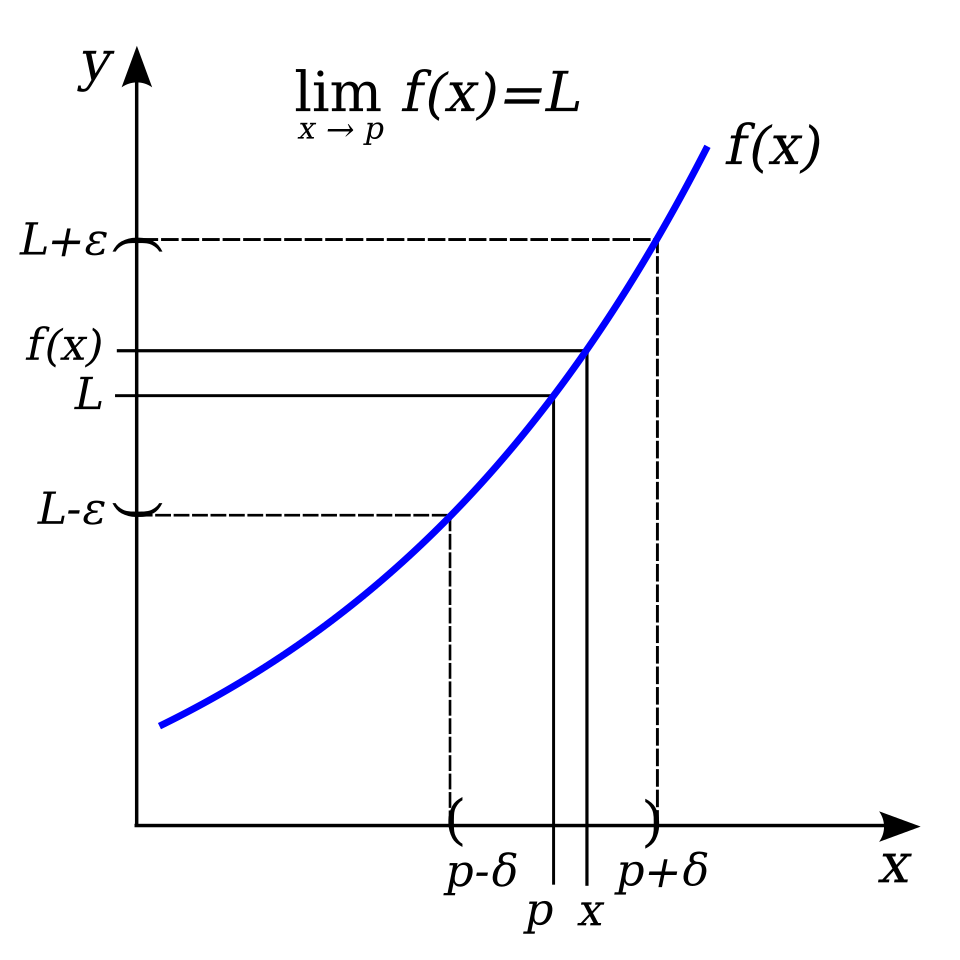
The diagram illustrates a function approaching a limit LLL as xxx nears ppp, with highlighted regions showing how values of f(x)f(x)f(x) remain close to LLL when xxx is sufficiently close to ppp. The ε–δ notation extends beyond AP requirements but visually reinforces the idea of controlled nearby behavior central to the limit concept. Source.
For instance, a graph may show a hole, a table may show values converging to the same number, and the analytic form may reveal a removable discontinuity. Only by integrating all three can students confidently justify the limit.
Addressing Representation-Specific Weaknesses
Each representation has limitations:
Graphs may hide fine-scale changes.
Tables provide only sampled values.
Analytic forms may mask removable discontinuities or be difficult to manipulate.
Combining representations allows discrepancies to be detected and resolved. If the graph suggests one behavior but the table implies another, analytic reasoning can clarify which is accurate.
Strategies for Solving Multi-Representation Limit Problems
Approach for Coordinating Multiple Forms of Evidence
Students should develop a systematic method that incorporates all available representations when determining a limit:
Inspect the graph first to gain intuition about the function’s trend near the target point.
Examine numerical data by checking whether values from both sides appear to move toward a common number.
Analyze the function algebraically to verify continuity, identify domain issues, or rewrite expressions into forms suitable for limit evaluation.
Confirm consistency across all representations, using analytic reasoning as the deciding factor when conflicts arise.
Justify conclusions by explicitly referencing how each representation contributes to the final limit statement.
Emphasizing One-Sided Behavior When Necessary
Many functions behave differently on the left and right sides of a point, making one-sided analysis essential. Students should:
Compare left-hand and right-hand graphical approaches.
Identify directional patterns in tables.
Use analytic expressions to determine whether the function behaves differently on each side.
Integrating Piecewise Functions Across Representations
Piecewise-defined functions are especially suited to multi-representation analysis because:
Graphs may show jumps or holes at boundaries.
Tables help detect mismatched values approaching from different sides.
Analytic expressions reveal how each piece behaves and whether the limit depends on comparing them.
Crafting Strong Justifications
To support a limit conclusion effectively, students should be able to articulate how each representation supports the same result. Strong explanations often highlight:
Agreement between the left- and right-hand trends in the graph.
Numerical values converging toward the same number.
Analytic confirmation using limit laws or continuity.
Using multiple representations does more than compute a number; it strengthens reasoning, uncovers subtle behavior, and ensures the conclusion is mathematically sound and well-supported.
Practice Questions
Question 1 (1–3 marks)
A function f is represented by both a graph and a numerical table.
• The graph shows that as x approaches 2, the curve approaches a height near 5, but there is a removable hole at x = 2.
• A table of values gives f(1.9) = 4.97, f(1.99) = 4.997, f(2.01) = 5.003, and f(2.1) = 5.03.
Using the combined information, determine the limit of f(x) as x approaches 2 and justify your answer briefly.
Question 1 (1–3 marks)
• 1 mark for identifying that values from both sides approach 5.
• 1 mark for stating the limit is 5.
• 1 mark for justifying that the limit exists regardless of the hole at x = 2.
Total: 3 marks.
Question 2 (4–6 marks)
A piecewise-defined function g is given by:
g(x) = 3x - 1 for x < 4
g(x) = k for x = 4
g(x) = 2x + 2 for x > 4
A graph of g shows a jump in the curve at x = 4, but a separate numerical table shows that values of g(x) for x approaching 4 from both sides move towards 11.
(a) Using the graph, state whether the left-hand and right-hand limits appear to agree or disagree.
(b) Using the table, determine the value of the limit of g(x) as x approaches 4.
(c) The analytic expressions 3x - 1 and 2x + 2 can be used to confirm the behaviour seen in the table. Use these expressions to determine the left-hand and right-hand limits.
(d) Using all three representations (graph, table, analytic expressions), explain whether the function can be made continuous at x = 4, and if so, determine the value of k that would achieve continuity.
Question 2 (4–6 marks)
(a) 1 mark: stating that the graph appears to show a jump, so the limits seem to disagree.
(b) 1 mark: stating that the table indicates the limit is 11.
(c) 1 mark for the left-hand limit using 3x - 1:
– substitution gives 3(4) - 1 = 11.
1 mark for the right-hand limit using 2x + 2:
– substitution gives 2(4) + 2 = 10.
(d) 1 mark for correctly concluding that the analytic expressions disagree, so the function cannot be made continuous unless both sides match.
1 mark for stating that continuity is impossible with the given pieces, because 11 does not equal 10, so no single value of k can make the limit from both sides equal.
Total: 6 marks.
FAQ
When representations conflict, the analytic expression usually provides the most reliable evidence because it reflects the exact behaviour of the function.
Graphs may distort steep or oscillatory behaviour, and tables sample only a limited set of points, so both can give misleading impressions.
A sound process is:
• First, check the analytic form for continuity or domain issues.
• Next, use tables to detect subtle trends.
• Finally, use the graph to support intuition rather than determine the limit alone.
These discontinuities reveal how different representations can suggest different conclusions unless they are interpreted together.
A graph may show a gap or jump, but a table can still hint at a value the function approaches, even if that value is not taken.
Analytic expressions then clarify whether the observed pattern is inherent to the function or simply a feature of its graphing.
This interplay helps distinguish between behaviour near a point and the defined function value at that point.
You should focus on the local behaviour of the curve, not the global shape.
Key features include:
• Whether left-hand and right-hand traces approach the same height.
• Any oscillation or rapid variation near the target x-value.
• Visible gaps, holes, or vertical tendencies suggesting unbounded behaviour.
Avoid relying on the exact plotted value at the point, as it may not reflect the true limit.
Values should approach sufficiently close to reveal a clear trend, but exact spacing is flexible.
Typically, meaningful tables include values decreasing by smaller increments on each side of the target, such as steps of 0.1, 0.01, or smaller depending on function behaviour.
The key is observing whether the outputs stabilise as x approaches the point. If the values diverge, oscillate, or settle at different values from each side, this indicates that the limit may not exist.
Piecewise functions often have boundary points where behaviour changes abruptly. Graphs may fail to show the precise meeting of pieces or may omit tiny gaps.
Multi-representation reasoning helps by allowing:
• Tables to capture the actual output behaviour on each side of the boundary.
• Analytic expressions to confirm the functional rule governing each segment.
• The graph to provide intuitive structure once numerical and analytic evidence guide interpretation.
Together, these representations prevent misinterpretation caused by incomplete sketches or missing detail.
