
AP Syllabus focus: ‘A mass spectrum for a single element can identify the element’s isotopes and show the relative abundance of each isotope in nature.’
Mass spectrometry provides an experimental “fingerprint” of an element by separating its atoms into isotopic signals. AP Chemistry focuses on what the peaks mean: which isotopes exist and how common they are.
What a Mass Spectrum Represents
A mass spectrum is a graph that displays signals from ions produced from a sample of a single element. Each signal (peak) corresponds to ions of a particular mass-to-charge value, allowing you to connect peaks to isotopes and their relative abundance in nature.
Mass spectrum: A plot of signal intensity versus mass-to-charge ratio () for ions produced from a sample.
Mass spectrometry does not “see” neutral atoms directly; it detects ions. For elemental spectra at the AP level, interpret each major peak as representing one isotope of that element.
Key Axes and Peak Features
x-axis (horizontal): , the mass-to-charge ratio of the detected ion
y-axis (vertical): intensity (signal size), which is related to how many ions of that type are detected
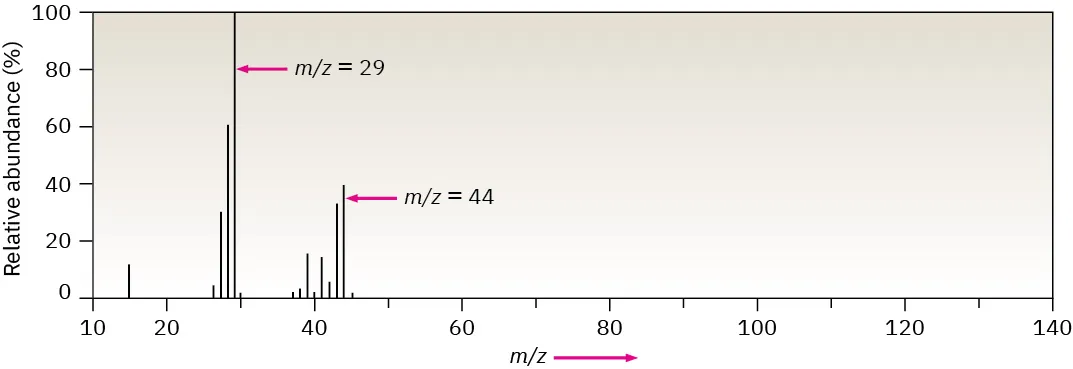
Example mass spectrum displayed as a bar graph with on the horizontal axis and relative intensity on the vertical axis. Even though this spectrum is for a molecule (propane), it is a clear illustration of how peak position is read from the x-axis while peak height represents how many ions of that were detected. Source
peak position: identifies an isotope by its mass (when the charge is understood)
peak height/area: indicates relative abundance (a comparison of how common isotopes are)
Isotope: Atoms of the same element with the same number of protons but different numbers of neutrons, giving different masses.
A spectrum with multiple prominent peaks indicates that the element occurs naturally as a mixture of isotopes rather than as a single mass.

Mass spectrum of boron shown as a stick plot, with two distinct peaks corresponding to its two naturally occurring isotopes (approximately mass numbers 10 and 11). The relative peak heights visually encode the isotopic mixture, illustrating how the more abundant isotope produces the larger signal. Source
Connecting Peak Position to Isotopes
In many AP-style elemental spectra, ions carry a single positive charge, so the value aligns closely with the isotope’s mass number (or isotopic mass, depending on how the spectrum is labeled). The central idea is that different isotopes create peaks at different values because their masses differ.
= mass of the ion (commonly in atomic mass units, amu)
= charge on the ion (in units of the elementary charge, dimensionless)
Peak positions therefore let you identify which isotopes are present in a sample of an element (for example, two peaks imply at least two isotopes).
What “Identifying Isotopes” Means in Practice
Each distinct peak corresponds to a distinct isotopic ion from that element.
The set of peak positions provides the element’s isotopic “pattern.”
If only one peak is present, the element is effectively monoisotopic in nature (or other isotopes are too rare to produce a visible signal).
Connecting Peak Size to Relative Abundance
The syllabus emphasis is that a mass spectrum for a single element shows the relative abundance of each isotope in nature. This means the spectrum reveals the isotopic proportions in the naturally occurring element (not necessarily in an artificially enriched sample).
Relative abundance: The proportion of each isotope present compared with the others, often expressed as a percentage of the total.
Important interpretation points:
A taller (or larger-area) peak means that isotope is more abundant in the sample.
Relative abundance is comparative: you interpret ratios (e.g., one peak about three times another suggests roughly a 3:1 abundance ratio).
Abundance read from spectra is typically normalized (the largest peak may be set to 100 on a relative intensity scale).
Common AP-Level Pitfalls
Confusing peak height with “mass”: mass is read from the x-axis, not the y-axis.
Assuming all isotopes are equally common: most elements have uneven natural abundances.
Treating the spectrum as a molecular formula tool: here, the focus is strictly identifying isotopes and their relative abundances for a single element.
Practice Questions
(2 marks) A mass spectrum of an element shows two peaks at and . What does this indicate about the element?
States the element has two isotopes (1)
Identifies them as isotopes with masses 35 and 37 (or mass numbers 35 and 37) (1)
(5 marks) A mass spectrum for a naturally occurring element shows three peaks at , 25, and 26 with relative intensities 79, 10, and 11 respectively. Explain what the spectrum tells you about the element.
Explains that three peaks indicate three isotopes of the same element (1)
Links each peak position to a different isotopic mass (24, 25, 26) (1)
States that peak intensity relates to relative abundance (1)
Correctly ranks abundances: 24 most abundant; 26 slightly more than 25 (1)
Interprets abundances approximately from intensities (e.g., , , ) (1)
FAQ
Many spectra use a relative intensity scale where the largest signal is set to 100 and others are scaled to it; this is not the same as percentage abundance.
Peak area is generally a better proxy for the number of ions detected, but AP-style questions typically treat height/intensity as proportional to relative abundance.
Yes. Very low-abundance isotopes may produce signals below detection or be omitted from simplified spectra.
Different combinations of mass and charge can yield the same $m/z$ (e.g., heavier ions with higher charge), which is why the charge state matters when assigning peaks.
Instrument calibration, limited resolution, and ion kinetic energy spread can broaden peaks or cause small shifts, though AP problems usually present idealised, clearly separated peaks.
