
AP Syllabus focus:
‘Tolerance ranges can involve factors such as temperature, salinity, flow rate, and sunlight, which can limit where organisms survive.’
Abiotic conditions set the “environmental envelope” for survival, growth, and reproduction. Understanding tolerance limits for major abiotic factors helps explain species distributions, habitat suitability, and why small changes can cause population declines.
Key idea: abiotic tolerance limits shape where organisms can live
Tolerance limits and performance
Organisms can persist only within certain ranges of abiotic conditions. Outside these ranges, physiological stress rises, reducing survival or successful reproduction, and populations shrink or disappear from that area.
Tolerance limit: The upper or lower value of an environmental (abiotic) factor beyond which an organism experiences injury, cannot reproduce effectively, or dies.
A useful way to think about tolerance is that “survival” and “optimal performance” are not the same:
Optimum range: conditions where growth and reproduction are highest.
Zones of stress: conditions that may allow short-term survival but reduce fitness (e.g., lower growth, fewer offspring).
Zones of intolerance: conditions beyond tolerance limits where persistence is not possible.
Limiting factors and range boundaries
Even if most conditions are suitable, one abiotic factor can set the boundary for distribution.
Limiting factor: The abiotic condition that most restricts an organism’s survival, growth, or reproduction in a given environment.
Common outcomes include:
Range edges where temperature extremes, salinity shifts, low light, or high flow prevent establishment.
Patchy distributions where microhabitats (shade, depth, shelter) keep conditions within tolerance.
Temperature tolerance
Why temperature is limiting
Temperature strongly controls enzyme activity, membrane stability, and metabolism. If body temperature (or tissue temperature) moves too far from an organism’s adapted range:
proteins may denature at high temperatures
metabolic reactions may become too slow at low temperatures
oxygen demand may outpace supply, especially in warm water
Ecological implications
Temperature tolerance helps explain:
latitudinal and elevational patterns (many species are absent beyond certain climates)
seasonal activity (e.g., dormancy or reduced feeding during extremes)
thermal refuges (shade, burrows, deep pools) where local conditions stay within tolerance
Salinity tolerance
Osmoregulation and stress
Salinity affects water balance and ion concentrations in cells. Organisms must maintain internal conditions despite external salinity:
In high salinity, water tends to leave the body, risking dehydration.
In low salinity, water tends to enter, risking ion dilution and swelling.
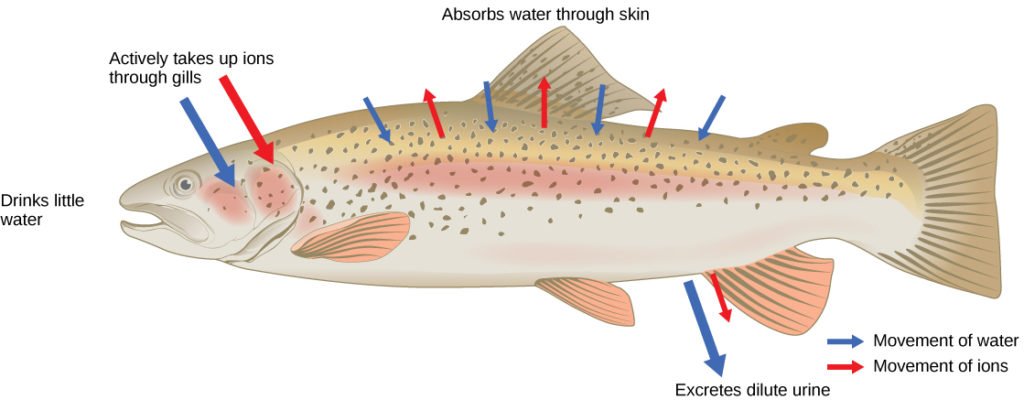
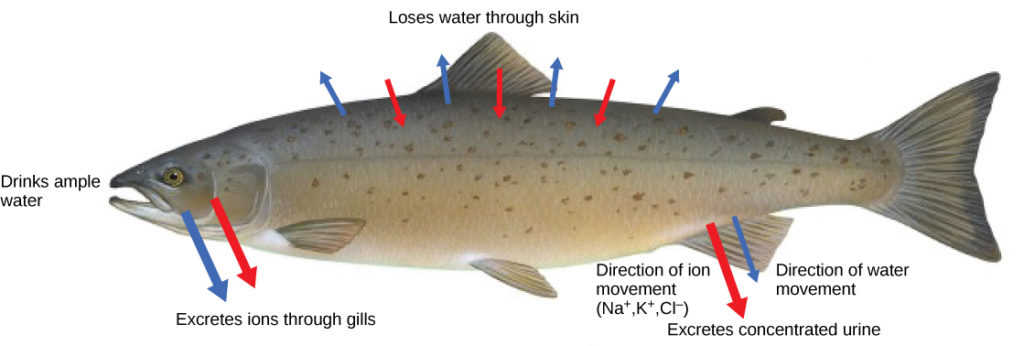
Side-by-side osmoregulation diagrams contrasting freshwater vs. marine fish. The figures emphasize the direction of osmotic water movement and the compensatory responses (drinking rate, urine concentration, and active ion transport at gills), linking salinity conditions to physiological stress and tolerance. Source
Species differ widely:
Stenohaline organisms tolerate only a narrow salinity range (common in stable marine environments).
Euryhaline organisms tolerate wide salinity ranges (common in estuaries where salinity fluctuates).
Ecological implications
Salinity tolerance can limit survival in:
estuaries where tides and river flow rapidly shift salinity
road-salt impacted streams where freshwater species may exceed tolerance limits
drought conditions that concentrate salts in soils and wetlands
Flow rate tolerance
Mechanical and energetic constraints
Flow rate (current speed in rivers, wave action on coasts, wind exposure on land) can be a limiting abiotic factor by:
increasing physical stress (dislodging or damaging organisms)
raising energy costs for maintaining position, feeding, or gas exchange
altering sediment transport, which can bury habitats or scour surfaces
Ecological implications
Flow tolerance influences:
where aquatic species can anchor, hide, or feed (e.g., behind rocks, in pools, within vegetation)
which plants can establish in riparian zones (seedlings may fail in frequent high-flow events)
oxygen and nutrient delivery: moderate flow may be beneficial, but excessive flow can exceed tolerance
Sunlight tolerance
Light as an abiotic driver
Sunlight is both a resource and a stressor:
For photosynthetic organisms, light sets the energy available for photosynthesis.
Too little light reduces growth; too much light can cause photoinhibition and overheating.
In terrestrial systems, sunlight also increases evaporation and water stress, indirectly pushing organisms beyond tolerance.
Ecological implications
Sunlight tolerance helps determine:
vertical zonation in water (depth limits where light is sufficient for aquatic plants/algae)
canopy vs understory species differences in forests (shade-tolerant vs sun-demanding plants)
habitat selection linked to thermal and moisture microclimates created by exposure
How tolerance limits interact in real habitats
Multiple abiotic factors act together
Tolerance ranges often overlap and interact:
Warm water can reduce dissolved oxygen availability, making temperature stress worse for aquatic animals.
High sunlight can intensify heat and water loss, narrowing effective tolerance in dry habitats.
High flow can reduce feeding time, lowering energy reserves needed to cope with salinity or temperature stress.
Variability and extremes matter
Organisms may withstand brief excursions near limits but fail under repeated or prolonged exposure. Key points:
extreme events (heat waves, storm-driven salinity changes, floods) can push conditions into intolerance zones
daily and seasonal cycles can determine which life stages survive (eggs/larvae often have narrower tolerances than adults)
microhabitats can keep conditions within tolerance even when the broader region is unsuitable
Practice Questions
State two abiotic factors that can set tolerance limits and, for each, describe one way it can restrict where an organism survives. (2 marks)
1 mark: Correctly names an abiotic factor (any two from temperature, salinity, flow rate, sunlight).
1 mark: For each named factor, a correct restriction described (e.g., temperature extremes reduce enzyme function; high salinity causes dehydration/osmotic stress; fast flow dislodges organisms/increases energy costs; low light limits photosynthesis).
A freshwater invertebrate is found only in shaded, slow-moving sections of a stream and is absent from sunny, fast-flowing sections downstream. Using tolerance limits, explain how abiotic factors could account for this distribution. (6 marks)
1 mark: Links distribution to abiotic tolerance limits (species absent where conditions exceed limits).
1 mark: Explains high flow rate as limiting (e.g., dislodgement, increased energy expenditure, reduced feeding).
1 mark: Explains sunlight as limiting directly or indirectly (e.g., photostress/overheating, increased water temperature).
1 mark: Connects sunlight to temperature stress (warmer water raising metabolic demand).
1 mark: Notes interaction of factors (combined stress narrows effective tolerance).
1 mark: Mentions refuges/microhabitats (shade/slow pools keep conditions within tolerance).
FAQ
They often infer limits by combining distribution data with environmental monitoring.
Methods include:
continuous sensors (temperature, conductivity as a salinity proxy, light, flow)
repeated surveys across gradients (upstream–downstream, shaded–sunny, shallow–deep)
identifying consistent absence beyond a threshold while controlling for habitat structure
Life stages can have different body sizes, surface-area-to-volume ratios, and physiological capacity.
For example:
juveniles may dehydrate faster under high sunlight/heat
eggs/larvae may lack strong osmoregulation, narrowing salinity tolerance
smaller individuals can be more easily dislodged by high flow
Two habitats can share the same mean condition but differ in swings and extremes.
A species might tolerate:
a mean of $15^\circ\text{C}$ with small daily change
but not:the same mean with repeated spikes to $25^\circ\text{C}$ that exceed its upper limit
Acclimation is short-term physiological adjustment within an individual’s lifetime.
Examples:
producing heat-shock proteins after gradual warming
adjusting membrane composition in cold conditions
altering ion transport rates when salinity changes slowly
These changes can widen effective tolerance temporarily but usually have limits and energetic costs.
Sunlight affects more than photosynthesis.
It can:
raise body temperature and increase heat stress
increase UV exposure that damages tissues
reduce moisture by increasing evaporation, indirectly pushing organisms past dehydration thresholds
