
AP Syllabus focus:
‘Patterns of population distribution vary with the scale of analysis, from local patterns to national, regional, and global comparisons.’
Population distribution varies widely depending on the geographic scale used to examine it, shaping how geographers interpret spatial patterns, identify trends, and compare human settlement across places.
Understanding Population Distribution Across Scales
Population distribution refers to where people live and how they are spread across Earth’s surface, an essential concept for analyzing human settlement patterns. Scales of analysis allow geographers to shift perspective, revealing different patterns at local, national, regional, and global levels. These variations help explain why population clusters form, how density appears differently across contexts, and how spatial patterns can be misinterpreted without attention to scale.
Why Scale Matters
Scale influences the patterns that become visible. A distribution that appears uniform at one scale may reveal significant clustering at another. Geographers must therefore select the appropriate scale to match the question they are investigating. Scale also shapes how data such as population density, settlement patterns, and spatial relationships are interpreted and compared (without requiring mathematical density formulas in this subtopic).
Global Scale Patterns
Viewing population distribution at the global scale highlights the broadest and most generalized patterns of human settlement. Common global observations include:
Concentration of population in the Northern Hemisphere.
Dominant clusters in East Asia, South Asia, Southeast Asia, and Western Europe.
Sparsely populated regions such as deserts, high mountains, tropical rainforests, and polar areas.
At this scale, the primary insight is the identification of global population clusters, showing how billions of people occupy only a small portion of Earth’s land.
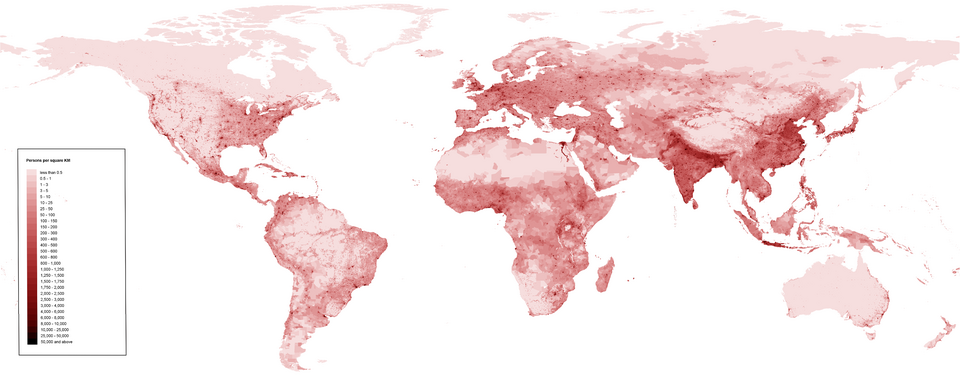
This map displays human population density across the globe in 2020, with darker shades indicating areas of higher density. It visually reinforces the concentration of population in major world regions such as South and East Asia, Europe, and parts of North America. The legend provides specific density ranges in people per square kilometer, including detail beyond the qualitative scale focus of this subtopic. Source.
Interpreting Global Patterns
At a global scale, geographers observe:
Strong links between population clusters and fertile river valleys, temperate climates, and coastal access.
Low human presence in areas with extreme environmental constraints, reinforcing the connection between physical factors and population distribution.
These generalizations are useful but limit the ability to detect finer-grained variations.
Regional Scale Patterns
The regional scale narrows the perspective to specific world regions, such as Sub-Saharan Africa, Latin America, South Asia, or East Asia. Within these regions, distribution is more nuanced. For example:
In East Asia, populations concentrate in coastal lowlands and river basins, but interior deserts and mountains show much lower density.
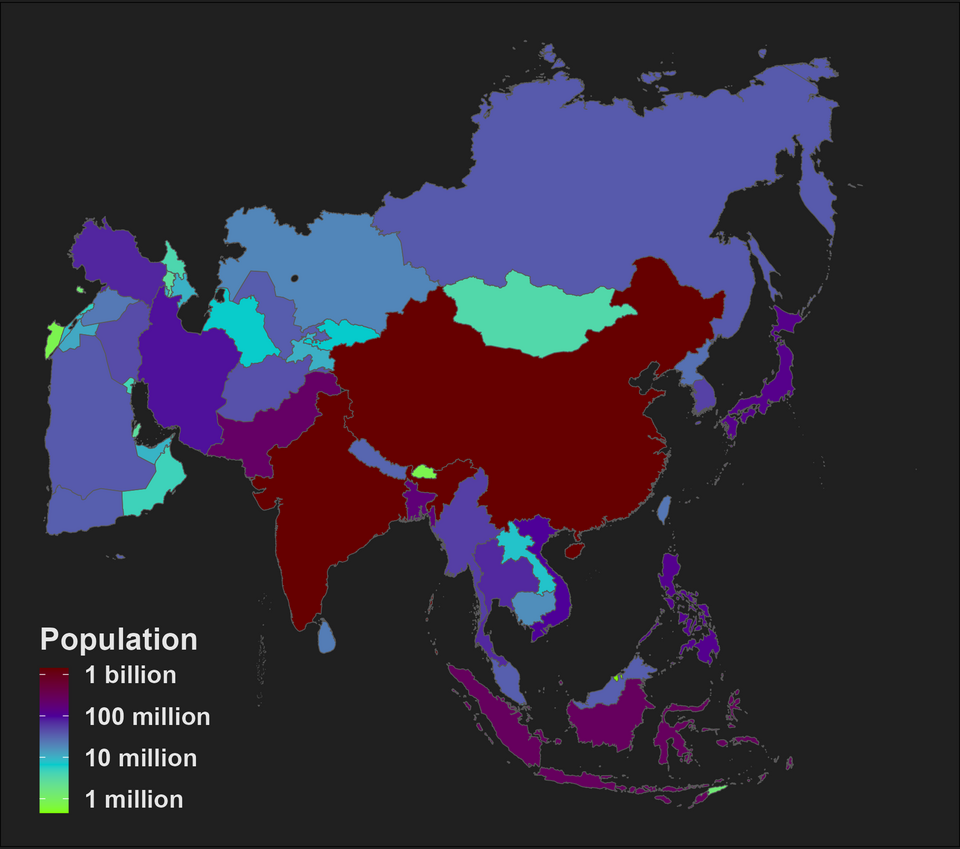
This regional map shows population density across Asia, highlighting dense settlement in eastern China, the Ganges Valley, and parts of Southeast Asia. It illustrates how fertile lowlands and major river systems support large populations while interior deserts, plateaus, and mountain regions remain sparsely settled. The detailed legend presents density categories beyond what is required in this subtopic but enriches geographic understanding. Source.
In Europe, even though much of the population is urbanized, there are clear differences between densely populated western regions and more sparsely settled eastern areas.
Regional patterns show how environmental and cultural factors interact across a distinct part of the world.
Key Regional Insights
Regional scales reveal contrasts between urban cores and rural peripheries.
They allow comparisons among countries that share certain historical or cultural characteristics.
Subregional differences—such as the corridor-like pattern along the Nile in North Africa—become clearer than at global scale.
National Scale Patterns
At the national scale, geographers examine how population is distributed within a single country. This scale offers a detailed look at internal variations shaped by national history, political organization, economic development, and internal migration. Examples include:
Uneven distribution across the United States, with dense populations along the East Coast, West Coast, and Great Lakes, and sparse settlement in the interior West.
Typical National-Level Observations
Primate cities or dominant urban centers may shape national distribution.
Urban–rural divides become clearer, showing how industrialization and economic opportunity influence settlement.
National policies, such as land reclamation or development programs, influence internal patterns.
At this scale, the political boundaries of the country serve as the frame for analysis.
Local Scale Patterns
The local scale provides the most detailed resolution, focusing on patterns within cities, neighborhoods, or specific landscapes. At this scale, distribution reflects highly specific factors such as zoning, land values, transportation networks, and neighborhood characteristics. Examples include:
Variation within a single metropolitan area, where high-density apartment districts contrast with low-density suburban zones.
Clustering around transit stations, universities, or employment centers.
Insights from the Local Scale
Local scales reveal micro-patterns, such as demographic clusters based on income, ethnicity, or land use.
They expose fine-grained spatial inequalities that are invisible at larger scales.
Local data help planners and geographers understand service provision, infrastructure needs, and community-level demographic trends.
Comparing Across Scales
Analyzing population distribution across multiple scales allows geographers to:
Identify how patterns change when zooming in or out.
Recognize that broad patterns may hide significant internal variation.
Evaluate how environmental, cultural, and economic factors interact differently at each scale.
Shifting scales is essential for avoiding misinterpretation and for gaining a comprehensive understanding of human spatial patterns.
Practice Questions
(1–3 marks)
Explain why examining population distribution at both the national scale and the regional scale can lead to different insights about settlement patterns.
(1–3 marks)
1 mark for recognising that different scales reveal different levels of detail (e.g., national scale shows internal variation; regional scale shows broader patterns).
1 mark for explaining that a distribution appearing uniform at one scale may show clustering at another.
1 mark for a clear reference to how factors (environmental, economic, political, or cultural) may appear more or less significant depending on the scale.
(4–6 marks)
Using examples, analyse how population distribution patterns change when shifting from the global scale to the local scale. In your answer, refer to at least two factors that shape these differences.
(4–6 marks)
1 mark for describing population distribution at the global scale (e.g., major clusters in East Asia, South Asia, Europe).
1 mark for describing population distribution at the local scale (e.g., variation within a city, high-density cores vs. low-density suburbs).
1 mark for identifying at least one factor that influences these differences (such as climate, landforms, economic opportunity, transport networks).
1 mark for explaining how these factors shape patterns differently at different scales.
1 mark for using at least one accurate example (global and/or local).
1 mark for a coherent analysis that links scale changes to changing interpretations or patterns.
FAQ
Different scales require different data resolutions. At the global scale, broad datasets such as national population totals or density averages are sufficient to identify major clusters.
At regional or national scales, geographers use more detailed data—subnational census counts, administrative boundaries, or regional demographic surveys—to reveal internal variation.
At the local scale, highly granular data such as neighbourhood-level records, land-use maps, and postcode or block-level counts are needed to show fine spatial patterns.
Scale affects how patterns appear. Large scales (like global) smooth out variation, making areas seem uniform when they are not.
At national or local scales, sharp differences within a region become visible, revealing details hidden at broader scales.
Misinterpretation occurs when findings from one scale are assumed to apply at another—for example, assuming a densely populated country has uniformly dense settlement everywhere.
Comparisons at the global scale highlight broad differences—such as heavily populated Asian regions versus sparsely populated polar areas.
At the regional scale, comparisons often focus on economic development levels, environmental conditions, or shared cultural histories.
At the national and local levels, comparisons become more detailed, involving internal settlement patterns, urbanisation levels, and spatial inequalities across smaller areas.
Political boundaries shape how data are collected and reported. At national scale, census units align with administrative boundaries, which may not reflect natural settlement patterns.
At regional or global scales, boundaries can distort comparisons because different countries use varying definitions or units of measurement.
At the local scale, small administrative units highlight patterns shaped by zoning, planning decisions, or municipal infrastructure.
Local scales reveal micro-patterns not visible at larger scales, such as:
• Clusters based on income or ethnic composition
• Land-use contrasts between central districts and suburbs
• Density variations along transport corridors or near economic hubs
These patterns help geographers understand how social, economic, and built-environment factors shape the fine structure of population distribution.
