
AP Syllabus focus:
‘Different density measures reveal different information about the pressure a population exerts on land and resources.’
Population density measures help geographers understand how people interact with land, revealing variations in resource demand, land use pressure, and human–environment relationships across different places.
Understanding Density Measures and Land Pressure
Population density provides a quantitative way to evaluate how intensely people occupy and use land. Because each density measure highlights different elements of human–environment interaction, geographers rely on multiple densities to interpret land pressure—the strain placed on land, resources, and environmental systems by human presence. Differences among arithmetic density, physiological density, and agricultural density allow analysts to identify where resource demand is highest, where agricultural systems may be stressed, and where population pressure does not align neatly with the amount of land available.
Key Population Density Measures
The interpretation of land pressure begins with understanding what each density measure reveals and what it conceals. Each form of density captures a different relationship between people and land.
Arithmetic Density: The total number of people divided by the total land area of a region.
Arithmetic density reflects broad population distribution, but it does not indicate whether the land is usable. A country with large uninhabitable areas—such as deserts, mountains, or tundra—may appear sparsely populated overall despite crowded urban regions. This measure is most useful for comparing general population concentrations at national or global scales.
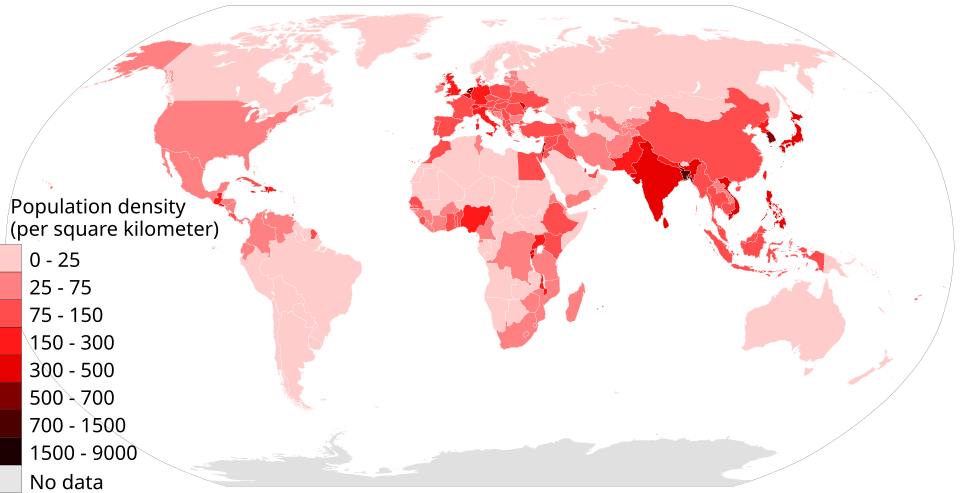
Arithmetic population density by country highlights major global concentrations of people across continents. The map illustrates densely populated regions such as South Asia, East Asia, and Western Europe. The detailed numerical legend exceeds AP exam requirements but reinforces how arithmetic density varies widely among states. Source.
After establishing arithmetic density, geographers turn to measures that better capture land’s productive capacity and how intensively people rely on specific land types.
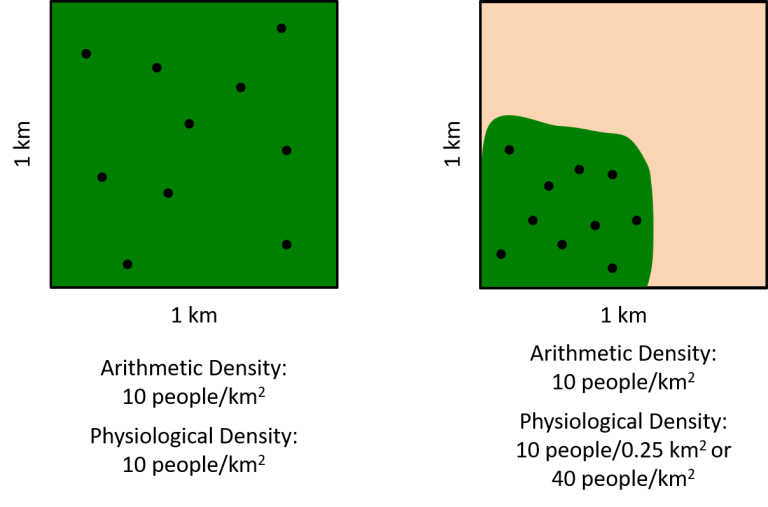
This conceptual diagram contrasts identical population totals in areas with differing amounts of arable land, producing different physiological densities. It clearly demonstrates why arithmetic density can mask underlying land pressure. Numerical values in the figure exceed the syllabus requirement but help clarify how density measures differ. Source.
Physiological Density: The number of people per unit of arable (farmable) land.
Physiological density reveals the pressure placed on a region’s productive land. Because arable land is essential for food production, this measure highlights potential stress on agricultural systems. High physiological density suggests limited farmland must support many people, indicating vulnerability to food shortages, reliance on imports, or the need for advanced agricultural technologies.
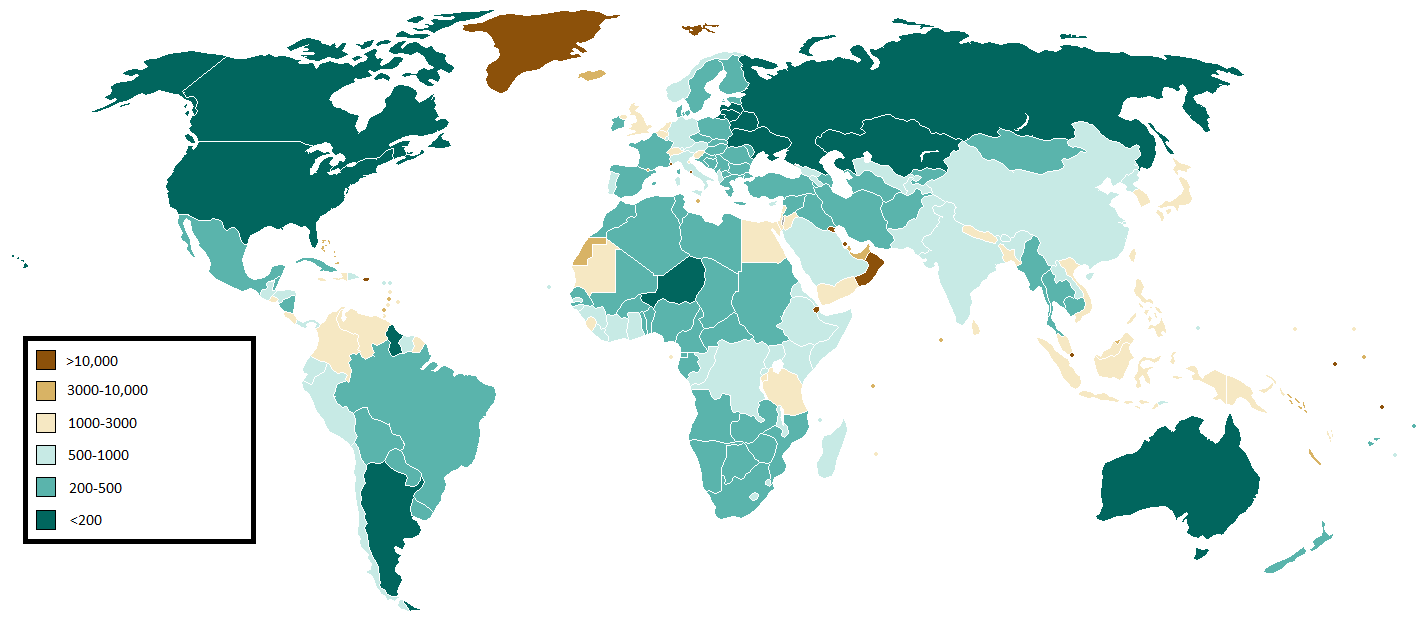
This world map shows how many people each country has per square kilometre of arable land, approximating physiological density. Darker colors indicate greater pressure on farmland and potential stress on food production systems. The detailed category ranges and reference year extend beyond AP requirements but strengthen understanding of global land pressure patterns. Source.
One additional density measure illustrates how people actively use the land for agriculture.
Agricultural Density: The number of farmers per unit of arable land.
Agricultural density reveals how labor-intensive farming is and reflects both technological development and economic structure. A high agricultural density indicates that many farmers are needed to produce food, suggesting subsistence agriculture or limited mechanization. Low agricultural density often corresponds with advanced agricultural technology, commercial farming systems, and higher economic development. Between density measures, agricultural density most directly reflects the human effort required to work the land.
Interpreting Land Pressure Through Density Measures
Interpreting density and land pressure involves synthesizing information from all three measures. When combined, they demonstrate whether a population’s size aligns with its land resources and whether the land is being used efficiently.
Indicators of Land Pressure
Geographers look for patterns that signal stress on land and resources:
High physiological density with high arithmetic density
• Suggests intense competition for limited farmable land.
• Indicates potential overuse of agricultural soils or dependence on imported food.
• Aligns with regions where physical geography restricts arable land.Low arithmetic density but high physiological density
• Occurs in states with large uninhabitable regions, such as deserts.
• Suggests that the habitable or arable land is under substantial pressure despite low overall population size.High agricultural density
• Indicates heavy reliance on manual labor and fewer technological inputs in farming.
• Reflects potential economic constraints, rural poverty, or limited access to mechanization.
• Suggests that more labor is required to sustain food production for the population.Low agricultural density paired with high physiological density
• Suggests efficient, technologically advanced agriculture capable of supporting large populations.
• Indicates relatively low land pressure despite high total demand for food.
Geographic Scale and Land Pressure
Interpreting density requires attention to scale because land pressure varies dramatically across local, regional, and national contexts. Patterns visible at the national scale may obscure high-density clusters or agricultural stress at smaller scales. For example:
At the local scale, land pressure may appear extreme in urban centers, where arithmetic density is high and ecological strain is concentrated.
At the regional scale, agricultural zones may experience higher physiological or agricultural density due to the limited extent of arable land.
At the national scale, overall densities may appear moderate, masking internal disparities that affect land management and resource use.
Why Density Interpretation Matters
Understanding density differences allows geographers and policymakers to identify resource vulnerabilities, anticipate environmental stress, and plan for sustainable development. Density measures help determine:
how much strain populations place on arable land
where agricultural modernization is needed
whether food supply systems are resilient
how population patterns shape future land use strategies
Across all scales, interpreting population density provides vital insight into the relationship between people, land, and resources, illustrating how population distribution shapes environmental and economic outcomes.
Practice Questions
(1–3 marks)
Explain why physiological population density is often a better indicator of land pressure than arithmetic population density.
(1–3 marks)
1 mark: Identifies that physiological density measures people per unit of arable land.
1 mark: Explains that this focuses on the land actually available for food production.
1 mark: States that it better reflects potential strain on resources or agricultural capacity than arithmetic density.
Maximum: 3 marks.
(4–6 marks)
Using examples, analyse how different population density measures (arithmetic, physiological, and agricultural) can be used together to assess the degree of pressure a population places on land and resources.
(4–6 marks)
Award marks for the following:
1 mark: Defines or accurately describes arithmetic density.
1 mark: Defines or accurately describes physiological density.
1 mark: Defines or accurately describes agricultural density.
1 mark: Explains how comparing these measures can reveal varying degrees of land pressure.
1 mark: Uses at least one appropriate example to illustrate contrasting density measures.
1 mark: Shows clear analysis of how the combined measures help assess resource demand, agricultural strain, or technological development.
Maximum: 6 marks.
FAQ
Physical features such as mountains, deserts, and wetlands reduce the amount of habitable and arable land, creating a gap between arithmetic density and physiological density.
When usable land is scarce, populations cluster in limited productive areas, making physiological density appear far higher than arithmetic density. This amplifies perceived land pressure even if total population size is modest.
Food security depends not only on how many people rely on each unit of arable land but also on agricultural inputs.
Countries with advanced irrigation, high-yield crops, or strong import capacity can sustain similar physiological densities with less stress. By contrast, states with poor infrastructure or limited trade access may face greater vulnerability at the same density level.
A low agricultural density suggests that few farmers can manage large areas of arable land, often due to mechanisation, fertilisers, and efficient transport networks.
A high agricultural density implies labour-intensive agriculture where technological adoption is limited. These differences help geographers assess how farming practices contribute to or alleviate land pressure.
Yes. Density measures act as early indicators of emerging pressures on farmland, water availability, and urban expansion.
Planners use trends in physiological and agricultural density to anticipate areas where intensification, land degradation, or food shortages may occur. These insights support long-term resource management strategies.
Density patterns can vary widely within a single country. National averages often mask localised areas of high stress.
For example, a country may have moderate arithmetic density overall but extremely high physiological density in fertile river valleys. Considering multiple scales prevents misleading conclusions about land use and resource strain.
