
AP Syllabus focus:
‘Geographers calculate population density using three measures: arithmetic density, physiological density, and agricultural density.’
Population density measures help geographers understand how people occupy space, revealing pressures on land and resources and offering insights into settlement patterns, land use, and human–environment interactions.
Calculating Population Density
Population density provides a foundational way for geographers to quantify how many people occupy a given area. Because different density measures illuminate distinct aspects of the human–land relationship, AP Human Geography emphasizes three key forms: arithmetic density, physiological density, and agricultural density. Each offers a unique analytical lens for understanding settlement patterns and the spatial organization of populations.
Why Multiple Density Measures Matter
A single numerical density value rarely communicates the full complexity of how people use land. Using multiple measures allows geographers to distinguish between broad population distribution, the intensity of pressure on arable land, and the agricultural labor force dynamics that influence food production. These measures help reveal disparities between regions, identify environmental constraints, and interpret land-use strategies.
Arithmetic Density
Arithmetic density is the most widely recognized population density measure and functions as a basic indicator of how many people occupy a unit of land area.
Arithmetic Density: The total number of people divided by the total land area of a region.
Arithmetic density is commonly used for comparing countries or regions at broad scales, offering a general impression of how crowded a place may be. However, it does not account for variations in land usability, meaning large areas of uninhabited terrain may distort perceptions of population distribution.
= People per unit of land area
A normal sentence here ensures compliance with required spacing and maintains clarity between conceptual blocks.
Interpreting Arithmetic Density
Geographers use arithmetic density to provide baseline comparisons:
Countries with very high arithmetic density appear broadly crowded.
Regions with low arithmetic density may have abundant land relative to population size.
The measure is useful for mapping global patterns of human settlement.
Yet, because it treats all land area equally, arithmetic density cannot reveal how people interact specifically with productive agricultural lands. Arithmetic density gives a broad overview of how crowded a country or region appears when total population is divided by total land area.
Physiological Density
Physiological density offers a more refined indicator by examining the relationship between population size and arable land, which is land suitable for farming.
Physiological Density: The number of people supported by a unit area of arable land.
Physiological density is critical for understanding land pressure, a key geographic concept describing the strain a population places on its agricultural resources. It highlights countries where limited arable land must support large populations, raising concerns about food security and long-term sustainability.
= People per unit of arable land
This sentence ensures separation before the next major explanatory section and reinforces conceptual continuity.
Interpreting Physiological Density
Physiological density highlights how many people must be supported by each unit of arable (farmable) land, rather than by all land in a country.
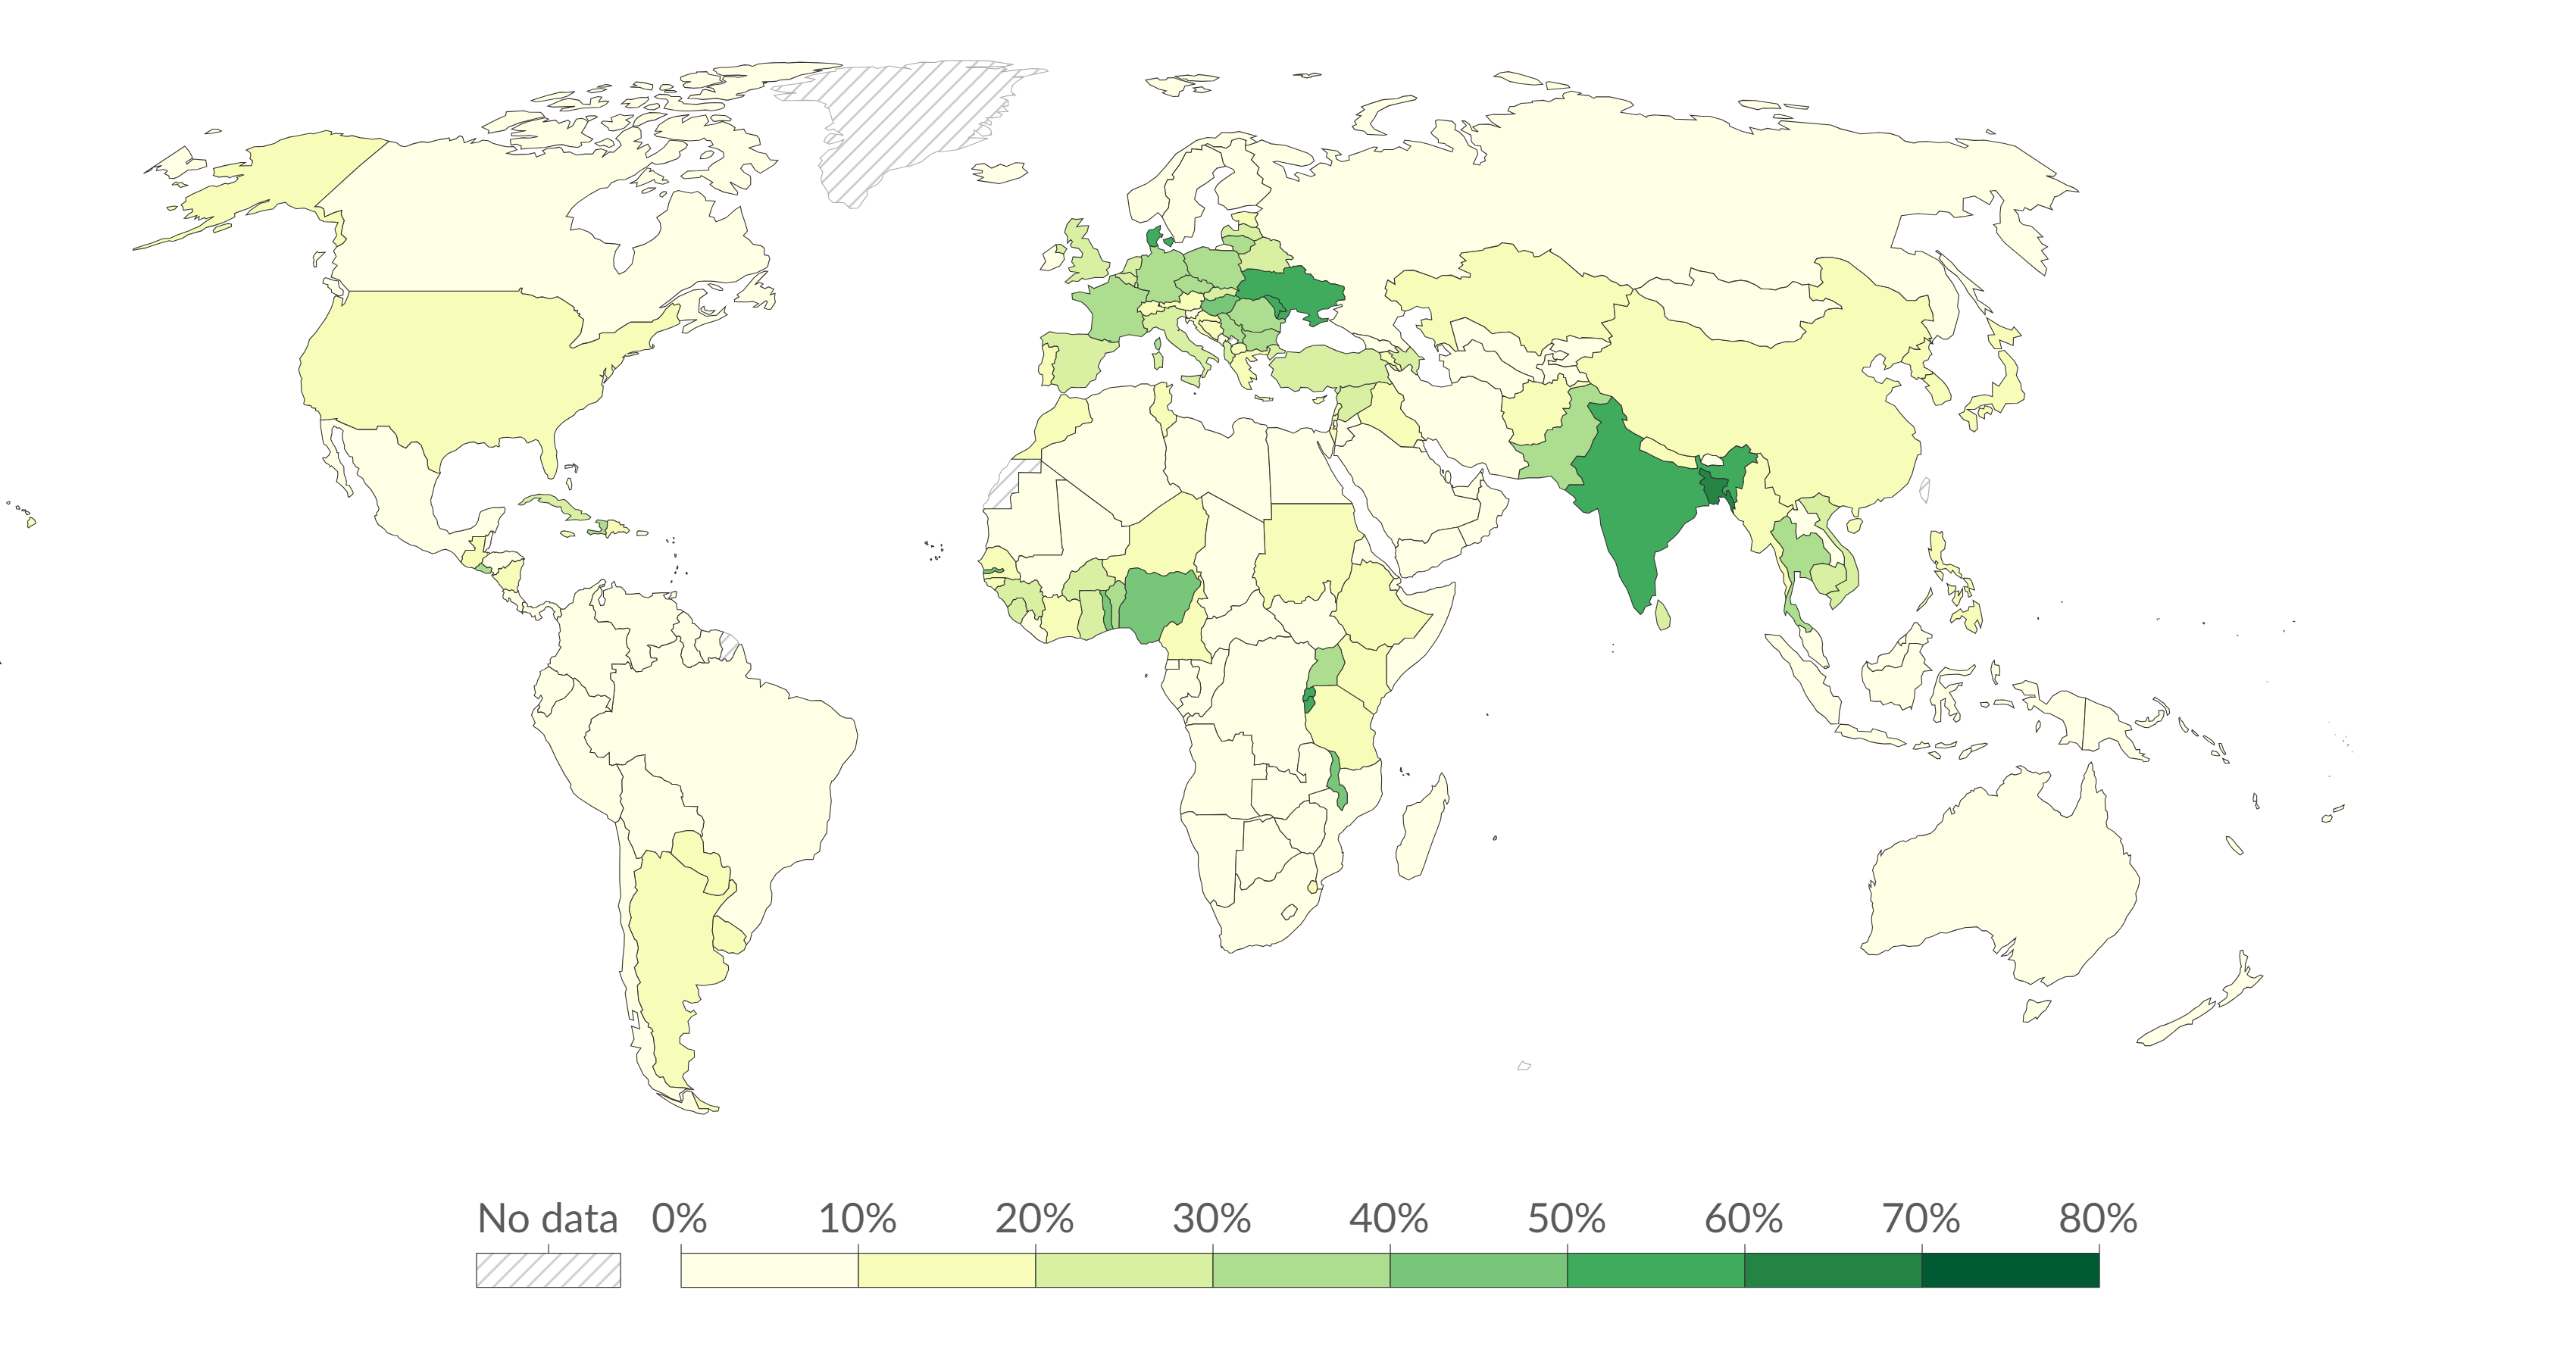
This map illustrates the percentage of each country’s land that is arable. Regions with limited arable land often experience higher physiological density when populations are large. Although the map includes more detail than required, it effectively highlights global variation in farmable land availability. Source.
Agricultural Density
Agricultural density focuses on the human labor force engaged directly in farming. It reflects how intensively farmers use land and sheds light on technological development within agriculture.
Agricultural Density: The number of farmers per unit area of arable land.
Agricultural density helps geographers distinguish between technological levels in agriculture. Regions with high agricultural density typically rely on labor-intensive farming techniques, while those with low agricultural density often employ advanced technology, capital-intensive machinery, and modern agricultural practices.
= Farmers per unit of arable land
Including this sentence helps maintain proper flow and allows students to connect density measures to broader geographic themes.
Interpreting Agricultural Density
Agricultural density reveals important relationships between population and agricultural capacity:
High agricultural density indicates reliance on human labor for food production.
Low agricultural density suggests greater agricultural efficiency and often correlates with industrialization and higher economic development.
Comparing agricultural and physiological densities shows whether a region's farming systems face labor or land constraints.
In highly developed economies, agricultural density is often low because a small number of farmers using advanced machinery can manage very large areas of arable land.
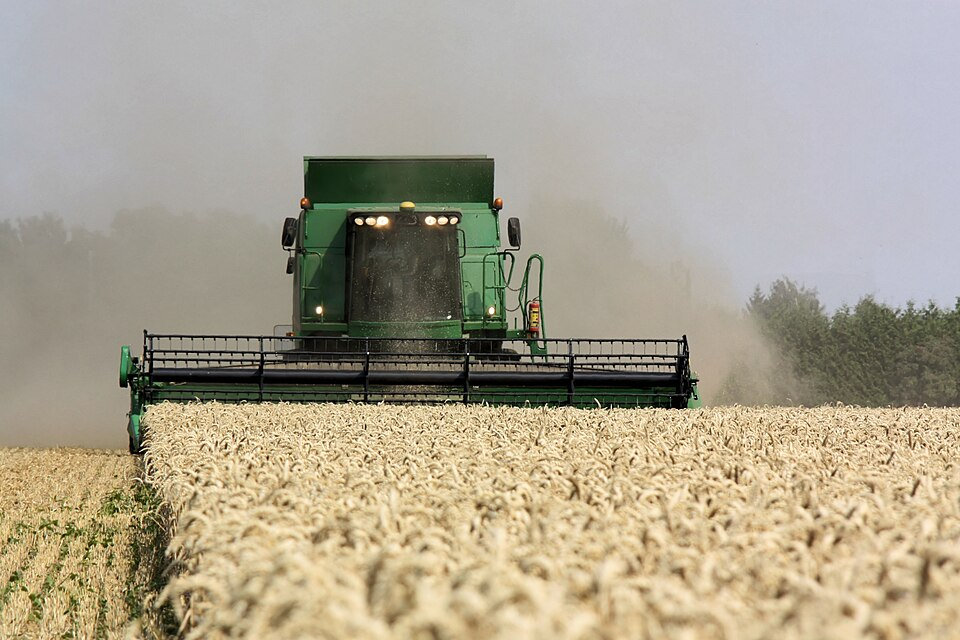
This photograph shows a modern combine harvester operating in a wide wheat field with no additional laborers present. It demonstrates how mechanization allows a small agricultural workforce to cultivate large areas, resulting in low agricultural density. While the image does not show density calculations, it clearly represents the technological conditions that lower farmer-per-land ratios. Source.
Using Density Measures in Geographic Analysis
Together, arithmetic, physiological, and agricultural densities provide a multidimensional understanding of population distribution. Geographers use these measures to:
Assess potential stress on land and resources.
Compare agricultural efficiency between countries.
Identify regions vulnerable to food insecurity.
Understand variations in economic development and land-use systems.
By applying all three measures, AP Human Geography students gain a deeper, more comprehensive picture of how human populations occupy space and interact with the land that sustains them.
Practice Questions
Question 1 (2 marks)
Define physiological population density and explain what it reveals about a country’s agricultural resources.
Mark Scheme (2 marks total)
1 mark for a correct definition of physiological density (people per unit area of arable land).
1 mark for explaining that it indicates the pressure placed on a country’s farmable land or its capacity to support its population with available agricultural resources.
Question 2 (5 marks)
Using your knowledge of the three main types of population density, explain why arithmetic density alone may give a misleading impression of how people use land in different countries.
Mark Scheme (5 marks total)
1 mark for identifying what arithmetic density measures (people per total land area).
1 mark for stating that it does not distinguish between usable and unusable land.
1 mark for explaining that physiological density provides insight into pressure on arable land.
1 mark for explaining that agricultural density reveals the relationship between farmers and farmable land, indicating technological or economic development.
1 mark for clearly stating why arithmetic density can therefore be misleading when comparing countries with large areas of uninhabited or non-arable land.
FAQ
Different units (square kilometres, square miles, hectares) do not change the underlying density relationship but can affect how easily comparisons are made between countries.
Using a consistent unit is essential for meaningful cross-regional analysis, as switching units may create the illusion of unusual density differences when none exist.
Physiological density can shift quickly if the amount of arable land changes due to soil degradation, irrigation expansion, or land reclamation, even when population growth is slow.
Arithmetic density changes mainly with population size, so it usually responds more gradually unless a country undergoes major migration or fertility shifts.
Arable land calculations exclude land that is:
Too dry, steep, frozen or infertile
Permanently used for forests, built-up areas or grazing
Not suitable for crop cultivation under current technology
These exclusions ensure that density measures focus only on land realistically usable for farming.
A high agricultural density suggests reliance on labour-intensive farming, signalling potential for mechanisation, investment or technological improvement.
A low agricultural density often indicates that the country already has mechanised systems, but may face future labour shortages or rural ageing if farming populations decline further.
Food security depends on more than land pressure. Countries with similar physiological densities may differ in:
Farming technology and crop yields
Access to global food markets
Transport and storage infrastructure
Government subsidies or agricultural policy
These factors can offset or amplify the strain suggested by physiological density alone.
