
AP Syllabus focus: ‘GDP is a key indicator of economic performance but does not capture all aspects of economic well-being.’
GDP is the most widely used snapshot of an economy’s size and performance. It helps compare output across time and countries, informs policy choices, and anchors expectations about jobs, incomes, and living standards.
What GDP Tells Economists and Policymakers
Gross Domestic Product (GDP): The market value of all final goods and services produced within a country’s borders in a given time period.
Because GDP is a single, comprehensive measure of production, it serves as a central scoreboard for macroeconomic performance. Used carefully, it helps answer: Is the economy expanding? How fast? How large is the economy relative to others? How much income is being generated by production?
A key indicator of economic performance
Economic performance often means changes in total output and income over time. GDP is useful because it:
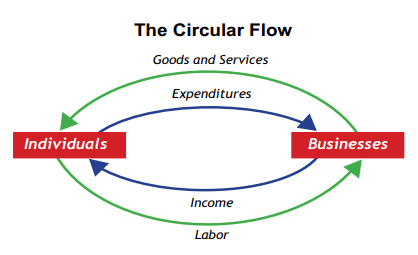
Circular-flow diagram showing how households supply labor to businesses and receive income, which is then spent on goods and services produced by businesses. This visual reinforces the idea that (in aggregate) production, income, and expenditure are tightly connected—one reason GDP serves as a central macroeconomic “scoreboard.” Source
Tracks economic growth (rising GDP) and contractions (falling GDP)
Signals changes in overall income generation, since production and income are closely linked in the circular flow
Provides a common metric for discussing the economy across households, firms, governments, and financial markets
Core Uses of GDP in Practice
Monitoring the business cycle and stabilisation goals
Policymakers use GDP data to identify broad changes in activity and to guide stabilisation policies aimed at:
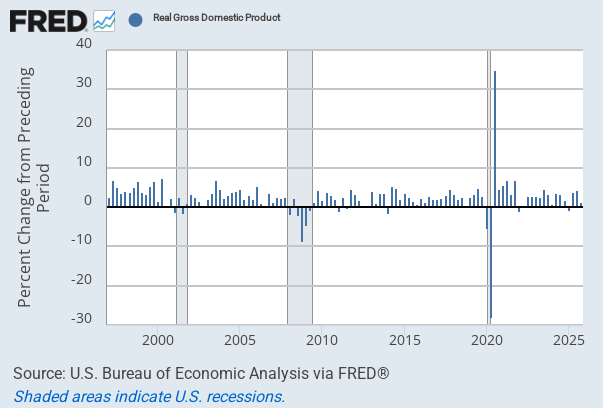
FRED Real GDP growth visualization with quarterly bars, where positive bars indicate expansions and negative bars indicate contractions; recessions are shown with shaded regions. It is a practical way to connect GDP growth rates to business-cycle turning points and the stabilization goals of growth, employment, and price stability. Source
Sustained growth
High employment (since output and labour demand tend to move together)
Stable prices (because rapid demand-driven growth can coincide with inflation pressures)
GDP growth rates are also used to judge whether the economy is likely overheating or underperforming, supporting decisions on fiscal and monetary actions.
Comparing output across time
GDP provides a consistent framework for comparing production across periods. This is valuable for:
Evaluating whether living standards are rising over decades
Assessing the impact of major events (financial crises, pandemics, oil shocks) on overall output
Setting medium-run targets (for example, national growth objectives)
Comparing economies
GDP helps compare the scale of economies and their global importance. Common comparisons include:
Total GDP (economic size)
GDP per capita (output per person, a rough proxy for average material living standards)
These comparisons shape international discussions about economic influence, development priorities, and market potential.
Guiding public finance and planning
Because much tax revenue is linked to incomes and spending generated by production, GDP helps with:
Forecasting tax receipts and planning budgets
Assessing debt sustainability (many ratios are expressed relative to GDP)
Planning public services and infrastructure consistent with the economy’s capacity
Interpreting GDP Carefully: Performance vs Well-Being
Why GDP is not a complete measure of welfare
The syllabus emphasises that GDP is a key indicator of economic performance but does not capture all aspects of economic well-being. Even when GDP rises, overall welfare may not improve proportionally because GDP:
Does not directly measure health, education quality, leisure, or security
Does not show income distribution (who benefits from growth)
Does not fully reflect environmental quality or sustainability
Cannot, by itself, indicate whether growth is broadly improving quality of life
Best practice interpretation
For high-quality analysis, GDP should be treated as:
A strong measure of market production
An incomplete proxy for well-being, requiring complementary indicators when the question concerns welfare rather than output
Practice Questions
(2 marks) State two reasons why GDP is useful to economists or policymakers.
1 mark for each valid reason (e.g., tracks economic growth over time; enables comparisons between countries; helps inform fiscal/monetary policy; assists budget forecasting).
(6 marks) Explain why GDP is considered a key indicator of economic performance, and evaluate why it may not fully measure economic well-being.
1 mark: GDP links to total output produced in the economy.
1 mark: GDP is used to track growth/changes in performance over time.
1 mark: GDP informs macroeconomic policy decisions (stabilisation aims).
1 mark: GDP allows comparisons across countries/periods using a common metric.
1 mark: GDP omits important welfare dimensions (e.g., health, leisure, distribution, environment).
1 mark: Clear evaluative statement that GDP should be complemented by other indicators for well-being.
FAQ
Initial GDP estimates are based on incomplete data and are often revised.
Revisions can change the perceived strength/timing of expansions or slowdowns, affecting how confidently policymakers interpret turning points.
Total GDP can rise simply because the population rises.
GDP per capita adjusts for population size, making cross-country and long-run comparisons of average material output more meaningful.
“Size” refers to the level of GDP at a point in time.
“Performance” usually refers to the growth rate and stability of GDP over time (how the economy is changing, not just how big it is).
GDP does not describe distribution or non-market outcomes.
Differences in inequality, public services, health outcomes, leisure, and environmental conditions can lead to very different welfare even with similar GDP.
GDP values output at market prices, which may not fully capture quality changes.
If products improve substantially without proportional price changes, measured GDP growth may understate improvements in what consumers actually receive.
