
AP Syllabus focus: ‘GDP does not measure quality of life, income distribution, or environmental sustainability.’
GDP is widely used to track economic performance, but it is an incomplete measure of human welfare. Understanding what GDP leaves out helps interpret headlines, compare countries, and evaluate policy goals more accurately.
What GDP Can and Cannot Tell Us About Well-Being
Gross Domestic Product (GDP) totals the market value of final goods and services produced within a country over a period of time. Because it is based on market prices and measured output, GDP is best interpreted as a measure of economic activity, not a comprehensive measure of well-being.
A common step is to scale output by population to approximate average material living standards.
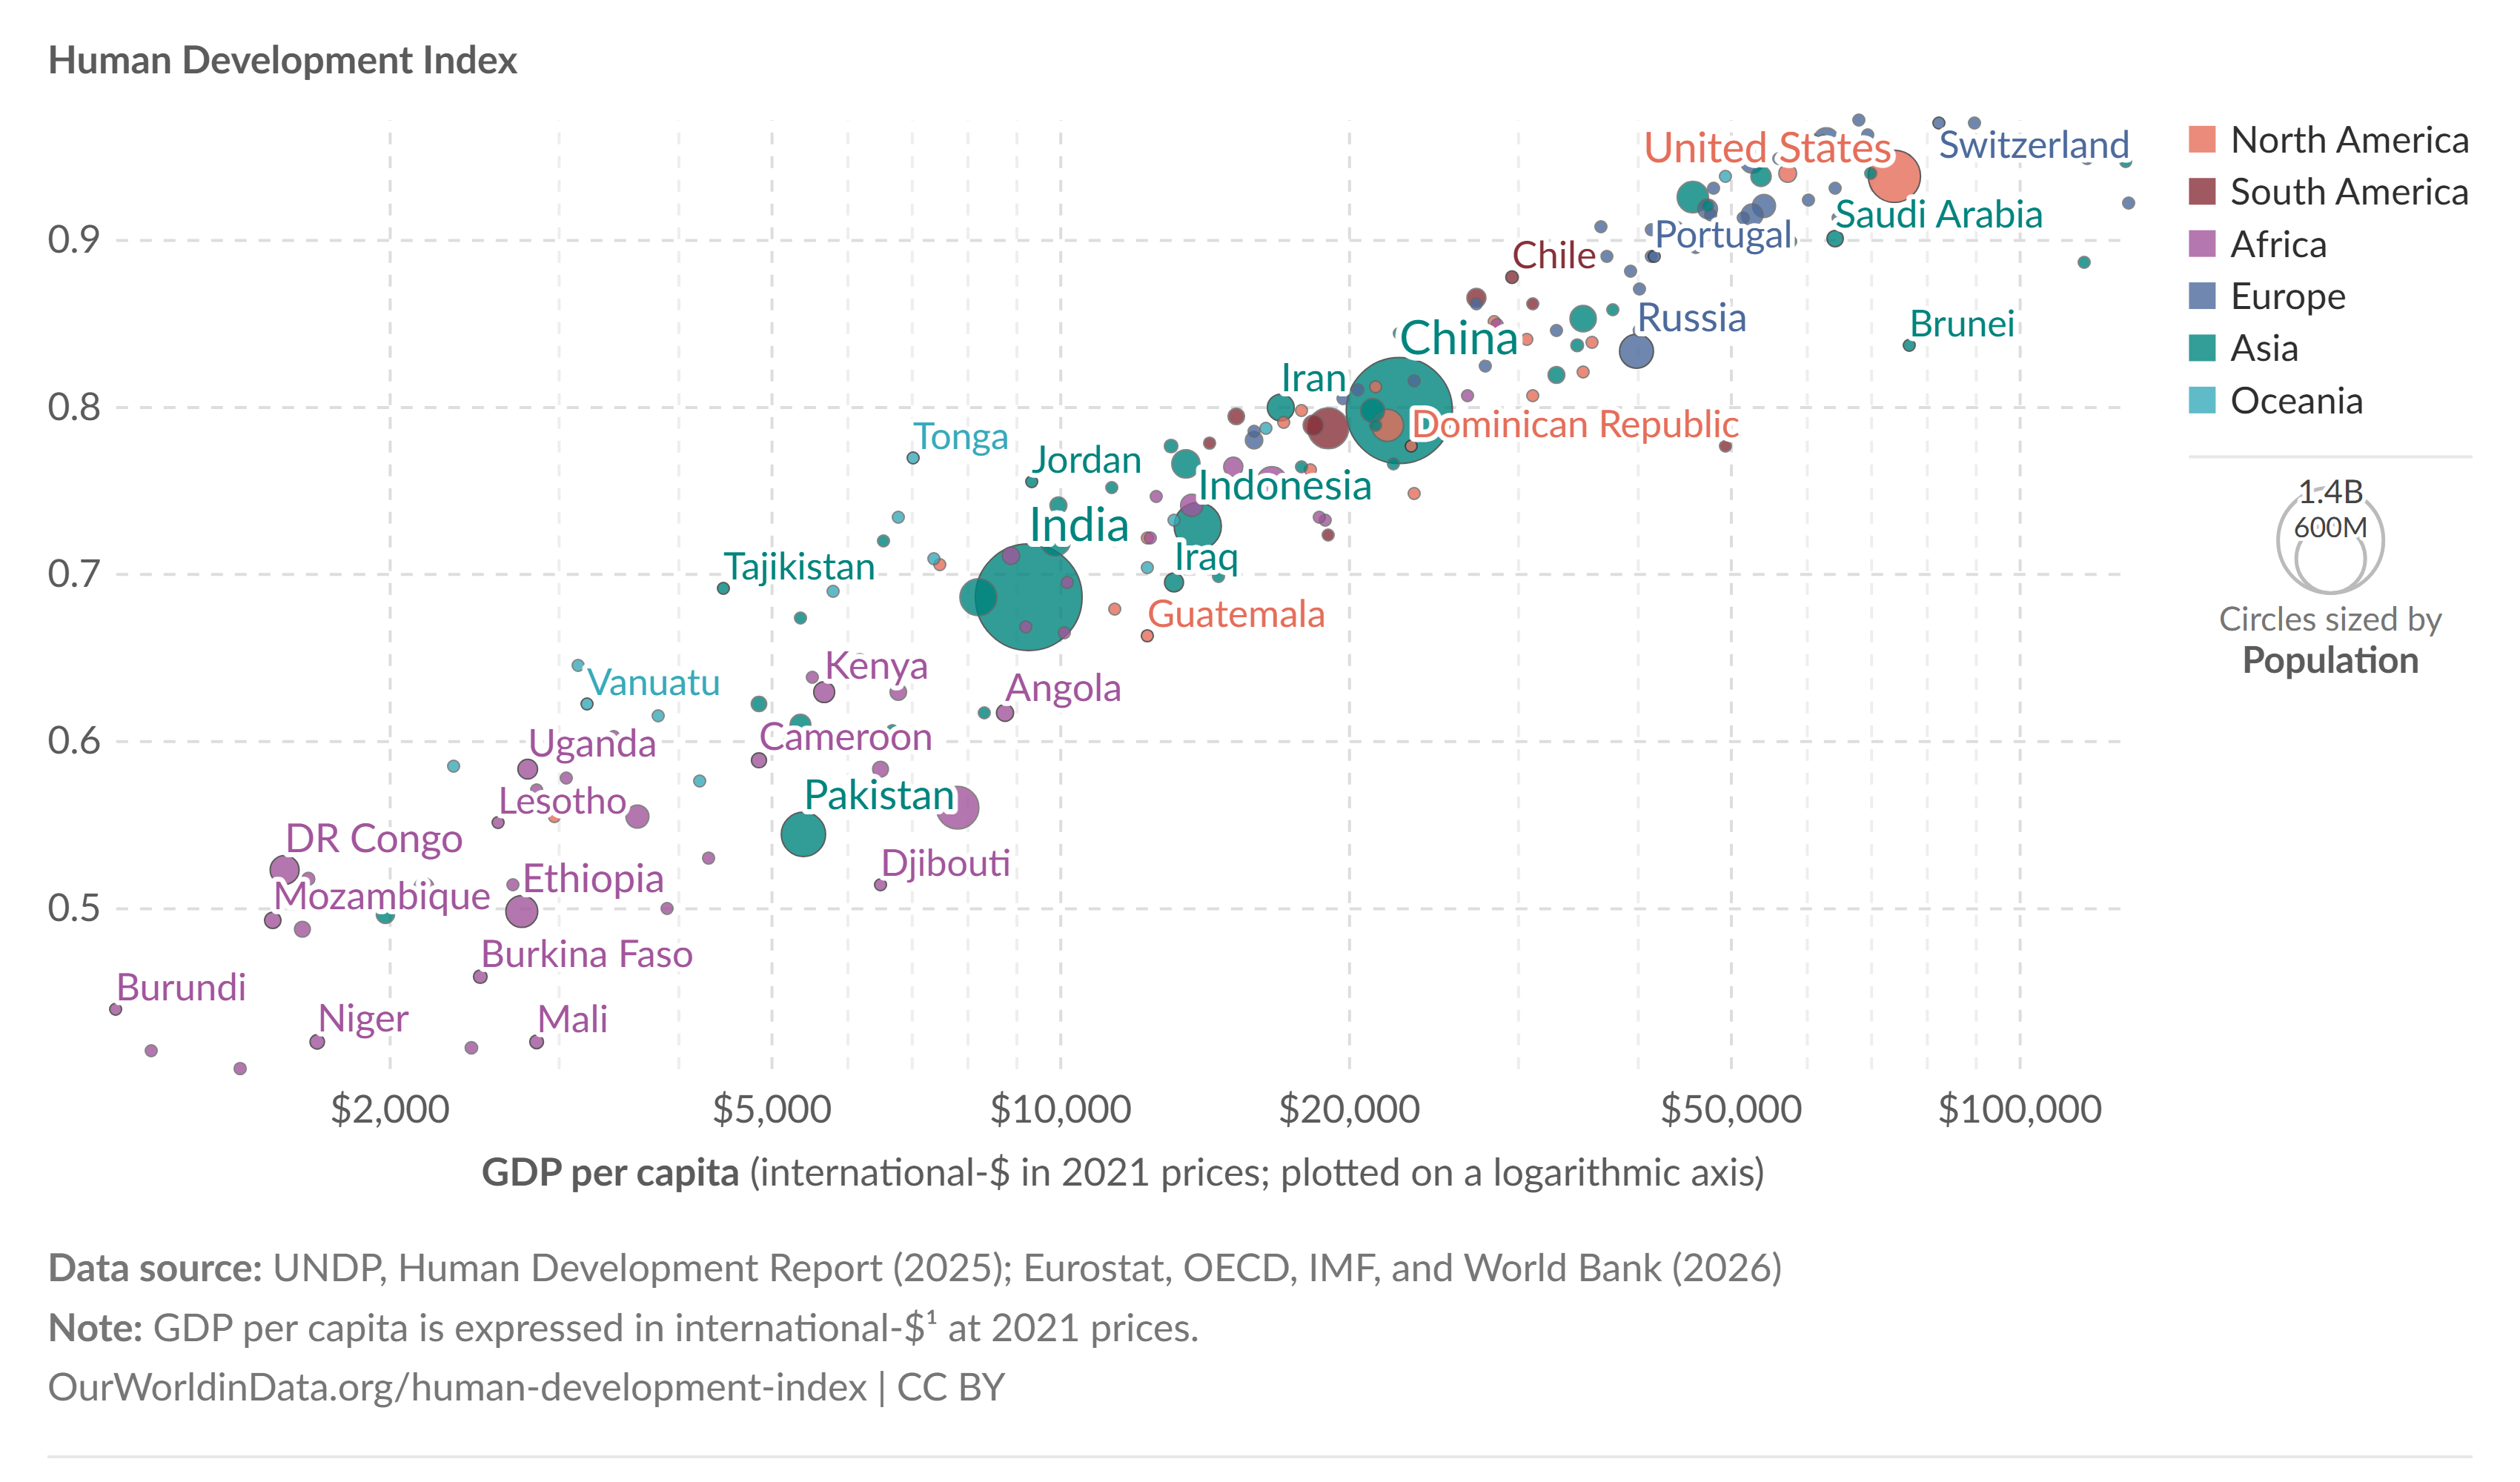
Scatter plot of Human Development Index (HDI) versus GDP per capita across countries (labeled, with year noted), showing that higher income is generally associated with higher human development but not perfectly. The spread of points at similar GDP per capita levels illustrates why GDP per capita is only a rough proxy for living standards and why health/education indicators add important context. Source
GDP per capita: GDP divided by the population; an average output (or income) measure per person, often used as a rough proxy for standard of living.
Even GDP per capita can mislead because well-being depends on more than average market production.
Quality of Life: What GDP Misses
Quality of life includes health, education, leisure, safety, political rights, and social cohesion—many of which are only imperfectly tied to market output.
Nonmarket benefits and costs
GDP excludes or undervalues many important contributors to welfare:
Leisure time: If people work longer hours, GDP may rise even if life satisfaction falls.
Household production and caregiving: Childcare by a parent typically raises well-being but is not counted unless paid in markets.
Community and informal support: Social networks can improve welfare without market transactions.
“Defensive” expenditures
GDP counts spending that responds to problems rather than increasing happiness:
Medical costs from preventable illness
Security spending due to higher crime risk
Cleanup costs after spills or disasters
These items raise measured output even when they reflect reduced underlying welfare.
Composition matters, not just total
GDP does not evaluate whether production matches what improves well-being.
More spending on addictive goods, congestion, or low-quality housing can raise GDP without clearly improving welfare.
Improvements in public health or safety may increase welfare more than an equal-dollar increase in luxury consumption, but GDP treats dollars similarly.
Income Distribution: Averages Hide Inequality
GDP and GDP per capita are averages; they do not show how income is distributed.
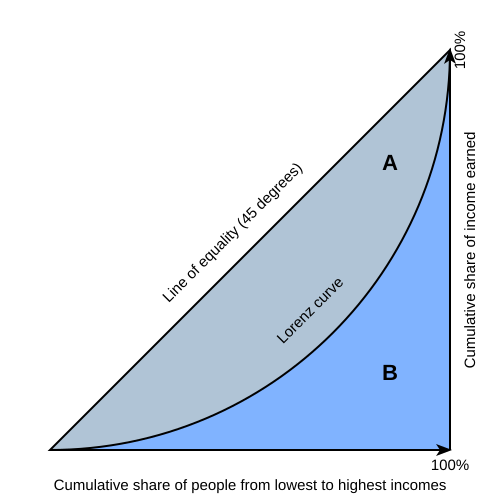
Lorenz curve diagram illustrating income distribution: the 45° line represents perfect equality, while the bowed Lorenz curve shows the cumulative share of income received by the bottom of the population. The shaded area between the equality line and the Lorenz curve (often labeled A) is the basis for the Gini coefficient, summarizing how unequal the distribution is. Source
Two economies with the same GDP per capita can have very different outcomes for typical households.
Why distribution changes the welfare interpretation
If GDP rises but gains accrue mainly to high-income households, median living standards may not improve much.
Low-income households tend to have a higher marginal utility of income; an extra dollar often raises their well-being more than it raises the well-being of a high-income household.
Inequality can affect access to essentials (healthcare, education, housing), shaping long-run well-being even if current GDP is high.
GDP does not reveal economic insecurity
GDP does not capture:
Job stability and predictable hours
Access to insurance and credit on fair terms
Exposure to volatile prices for necessities
An economy can have high GDP with substantial insecurity that reduces welfare.
Environmental Sustainability: Output Today vs Welfare Tomorrow
GDP is a flow measure of current production; it does not directly track whether that production erodes the resource base needed for future living standards.
Negative externalities and omitted costs
When production creates pollution, market prices often fail to include the full social cost.
Negative externality: a cost imposed on third parties from production or consumption that is not reflected in market prices, leading to overproduction relative to the social optimum.
Because GDP uses market prices, it can rise alongside:
Air and water pollution
Greenhouse gas emissions
Habitat loss and biodiversity decline
Resource depletion and “running down” natural capital
Extracting nonrenewable resources boosts current GDP, but it may reduce future capacity to produce and enjoy consumption.
GDP does not subtract depletion of forests, fisheries, or mineral stocks as depreciation of natural capital.
Long-term climate risks can be increased by today’s output, yet GDP records the production without accounting for future damages.
Cleanup and rebuilding can inflate GDP
Environmental disasters can raise GDP through remediation and reconstruction spending, even though overall welfare is lower due to lost ecosystems, health, and property.
Using GDP Carefully in Well-Being Discussions
GDP remains valuable for tracking business cycle conditions and overall production, but it should be interpreted with complementary information:
Pair GDP with indicators of health, education, and safety for quality-of-life context.
Use distributional statistics (such as median income or inequality measures) to interpret how typical households are doing.
Consider environmental indicators (emissions, air quality, resource stocks) to judge sustainability.
Practice Questions
(3 marks) State and briefly explain two reasons why GDP may not accurately reflect economic well-being.
1 mark: Identifies a valid limitation (e.g., does not measure quality of life/non-market aspects; ignores income distribution; ignores environmental sustainability).
1 mark: Explains the first limitation in context of well-being (e.g., GDP can rise while leisure/health falls; averages hide inequality).
1 mark: Explains the second limitation in context of well-being (e.g., pollution/resource depletion not subtracted; external costs not priced in).
(6 marks) A country’s GDP per capita has risen steadily for five years. Evaluate the claim that the country’s economic well-being must therefore have improved.
1 mark: Recognises GDP per capita is an average and may not reflect typical living standards.
1 mark: Explains how worsening income distribution could mean median welfare does not rise.
1 mark: Discusses a quality-of-life omission (e.g., health outcomes, leisure, safety, non-market production).
1 mark: Discusses an environmental sustainability omission (e.g., pollution, depletion of natural capital, negative externalities).
1 mark: Develops evaluation by noting GDP can still correlate with material living standards/consumption possibilities.
1 mark: Overall judgement that depends on evidence from distributional, social, and environmental indicators alongside GDP.
FAQ
They may combine output with distributional measures to approximate the welfare of a “typical” person.
Common approaches include:
Using median income/consumption rather than averages
Applying inequality weights (extra weight to gains for lower-income groups)
Reporting “distributional national accounts” that split growth by income groups
Green GDP is an adjusted measure that subtracts environmental degradation and resource depletion from conventional GDP.
It is difficult because it requires:
Valuing non-market damages (health, ecosystems) in money terms
Estimating long-run climate impacts and discounting future harms
Avoiding double-counting when damages overlap
GDP can increase due to spending that does not raise welfare, such as “defensive” expenditures.
Examples include:
Higher medical spending from preventable disease
Increased commuting costs due to congestion
More spending on security in response to crime risk
Several indices combine economic and social indicators rather than relying on GDP alone.
Examples:
Human Development Index (HDI) (income, education, life expectancy)
OECD Better Life Index (housing, work-life balance, safety, etc.)
Subjective well-being/happiness surveys (self-reported life satisfaction)
Including unpaid household production can change comparisons across time and groups.
It tends to:
Increase measured “output” in economies with more home production
Highlight welfare contributions from caregiving not captured in markets
Complicate comparisons because valuing time requires assumptions about wages and productivity
