
AP Syllabus focus: ‘Demand curves slope downward because of the income effect, the substitution effect, and diminishing marginal utility.’
A downward-sloping demand curve captures a common pattern: when price falls, buyers typically want more. This page explains the three core microeconomic reasons behind that pattern and when each reason matters most.
What it Means for Demand to “Slope Downward”
A demand curve shows the relationship between a good’s price and the quantity demanded (with other relevant factors held constant). For most goods, lower prices are associated with higher quantities demanded, and higher prices with lower quantities demanded.
Reason 1: The Substitution Effect
When the price of a good falls, it becomes relatively cheaper compared with other goods, so consumers tend to switch toward it.
Substitution effect: The change in quantity demanded caused by a change in a good’s relative price, leading consumers to substitute toward the relatively cheaper option and away from relatively more expensive alternatives.
The substitution effect is strongest when:
Close substitutes exist (many similar brands or alternatives)
The good is easy to replace in consumption (few switching frictions)
Consumers can compare options easily (clear prices, low search costs)
Even if a consumer’s purchasing power stayed the same, a lower relative price would still encourage substitution toward the good.
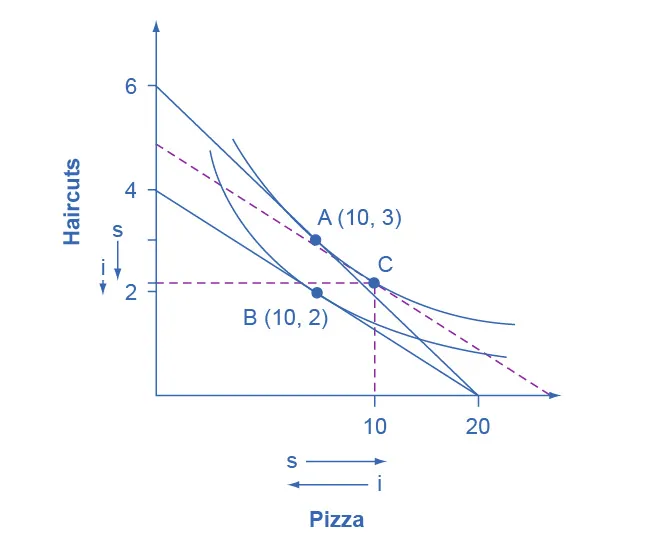
Indifference curves with an original and new budget constraint, plus a dashed “compensated” budget line used to split a single price change into two parts. The move from the initial bundle to the tangency on the dashed line isolates the substitution effect (relative-price change holding utility constant), and the move from that point to the final optimum shows the income effect (the purchasing-power change). Source
Reason 2: The Income Effect
A fall in price increases the consumer’s purchasing power: with the same income, they can afford more of the good (and potentially more of other goods too).
Income effect: The change in quantity demanded caused by a change in real purchasing power (real income) resulting from a price change, holding money income constant.
The income effect helps explain why demand curves slope downward for normal goods in particular: when purchasing power rises, consumption tends to rise. For inferior goods, the income effect works in the opposite direction (higher purchasing power can reduce quantity demanded), but the substitution effect often still dominates for typical inferior goods.
Key intuition:
Price ↓ → “real income” ↑ → ability to buy ↑
For most goods, that boosts quantity demanded
Reason 3: Diminishing Marginal Utility
Consumers generally value additional units of a good less than earlier units, so they require a lower price to be willing to buy more units.
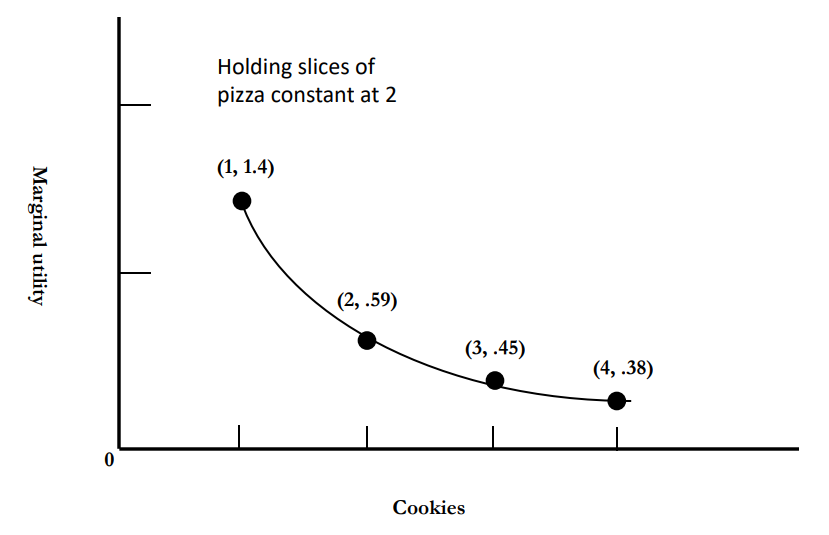
A marginal utility curve that declines as the quantity of cookies consumed increases, holding other consumption fixed. The downward shape visualizes diminishing marginal utility: each additional unit adds less extra satisfaction than the previous unit, supporting a lower willingness to pay for later units. Source
Marginal utility (MU): The additional satisfaction or benefit a consumer receives from consuming one more unit of a good.
A crucial pattern is:
Diminishing marginal utility: As a consumer consumes more units of a good (over a given time period), the marginal utility from each additional unit tends to fall.
How this creates a downward-sloping demand curve:
Early units deliver high marginal benefit, so consumers are willing to pay more for them.
Additional units deliver lower marginal benefit, so consumers are only willing to buy them at lower prices.
A demand curve can be seen as a schedule of maximum willingness to pay for each successive unit, which declines as marginal utility diminishes.
How the Three Reasons Fit Together
In most realistic settings, all three forces operate simultaneously:
Substitution effect: “This good is cheaper than alternatives, so I’ll switch toward it.”
Income effect: “My money goes further, so I can buy more.”
Diminishing marginal utility: “Extra units aren’t as valuable, so I’ll only buy more at a lower price.”
Which force matters most depends on context:
With many alternatives, the substitution effect tends to be large.
For goods that take a big share of a budget, the income effect tends to be more noticeable.
For goods consumed in multiple units (and where additional units quickly become less valuable), diminishing marginal utility is especially important.
Important Clarifications and Scope
These explanations describe why demand is typically downward sloping, but they rely on common assumptions:
Preferences are reasonably stable over the time period considered.
The good provides less and less additional benefit at the margin for most consumers.
Consumers respond to relative prices and purchasing power.
In rare cases discussed in more advanced contexts, a good could exhibit unusual behavior, but the AP Microeconomics baseline is that these three forces explain the negative price–quantity relationship.
Practice Questions
(2 marks) Explain how the substitution effect contributes to a downward-sloping demand curve for a good.
1 mark: States that a fall in price makes the good relatively cheaper than alternatives.
1 mark: Links this to higher quantity demanded due to consumers switching towards the cheaper good.
(5 marks) Using the concepts of the income effect, substitution effect, and diminishing marginal utility, explain why a typical demand curve slopes downward.
1 mark: Correct explanation of the substitution effect (relative price change leads to substitution towards the good when price falls).
1 mark: Correct explanation of the income effect (price fall increases real purchasing power, tending to increase quantity demanded for normal goods).
1 mark: Correct explanation of diminishing marginal utility (additional units yield less extra benefit).
1 mark: Connects diminishing marginal utility to willingness to pay falling for additional units (thus lower prices needed for higher quantities).
1 mark: Coherent link to the overall inverse relationship between price and quantity demanded (demand curve downward sloping).
FAQ
It can fail over some ranges if additional units become more valuable (e.g., due to collecting, thresholds, or complementarities within the good).
If marginal utility rises over a range, willingness to pay for extra units may not fall there, weakening the usual downward slope over that segment.
They underpin why maximum willingness to pay typically declines with quantity: marginal benefit falls (diminishing MU), and when price changes, relative price comparisons (substitution) and purchasing power (income) shift the chosen bundle.
If a good is a tiny share of the budget, a price change barely changes real purchasing power.
But the good can still become much cheaper relative to close substitutes, producing a strong substitution response.
Habit formation can reduce short-run responsiveness to relative price changes, muting the substitution effect.
Diminishing marginal utility may also be less pronounced over short horizons if cravings or dependence affect perceived marginal benefit.
A Veblen-type pattern can occur when higher prices raise perceived status, increasing demand for signalling reasons.
A Giffen case can occur when a strong negative income effect for an inferior staple outweighs the substitution effect, so price rises increase quantity demanded over a range.
