
AP Syllabus focus: ‘Market demand is the sum of individual demand schedules. Changes in demand determinants shift the entire demand curve.’
Market demand connects individual consumer choices to the total demand faced by firms in a market. Mastering how to add individual demands and recognise true demand shifts is essential for accurate graphs and clear causal explanations.
Market demand: what it is and how it’s built
Individual demand vs market demand
Market demand: The relationship between the price of a good and the total quantity demanded by all buyers in the market at each price, holding other factors constant.
Market demand comes from combining many individual demand schedules. At any given price, each consumer chooses a quantity demanded; the market quantity demanded is the total of those quantities.
Horizontal summation (the key graphing idea)
To construct a market demand curve from individual demand curves:
Choose a price level.
Read each consumer’s quantity demanded at that price.
Add quantities across consumers to get market quantity demanded.
Repeat for other prices and connect the points to form the market demand curve.
Because you add quantities at the same price, this is called horizontal addition (adding along the quantity axis).
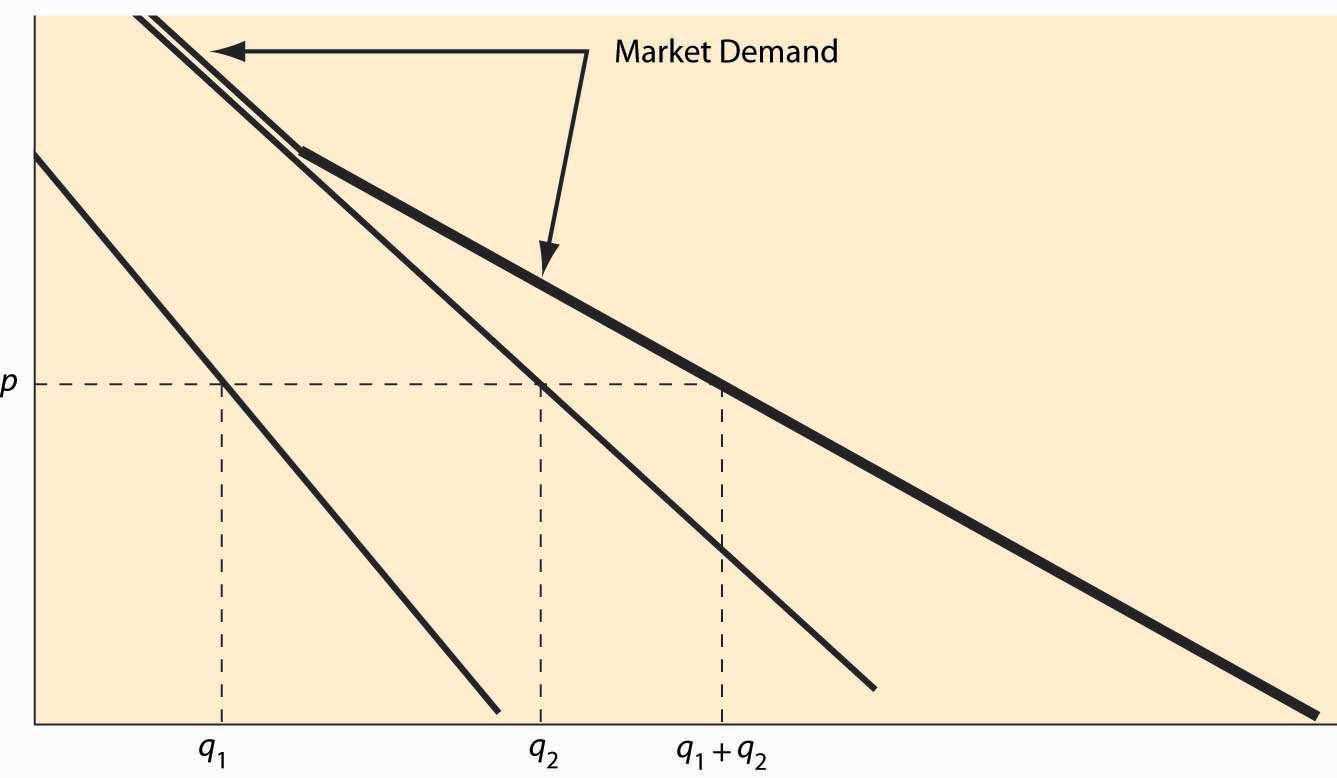
This figure illustrates how a market demand curve is formed by horizontally summing individual demand curves. At the same price , each consumer’s quantity demanded ( and ) is added to get total market quantity demanded (). Repeating this across prices traces out the market demand curve (the thicker line). Source
The “number of buyers” effect
Market demand depends not just on preferences, but also on how many consumers participate:
If more buyers enter the market, market quantity demanded at every price is larger, so market demand shifts right.
If buyers exit, market demand shifts left.
Shifts in demand (changes in the whole relationship)
A demand shift means that at the same price, consumers now want a different quantity than before due to a change in a determinant of demand (a non-price factor). This is different from a movement along the curve, which is caused only by a change in the good’s own price.
Demand (shift): A change in quantity demanded at every price, shown as a leftward or rightward shift of the entire demand curve.
A rightward shift means higher quantity demanded at every price; a leftward shift means lower quantity demanded at every price.
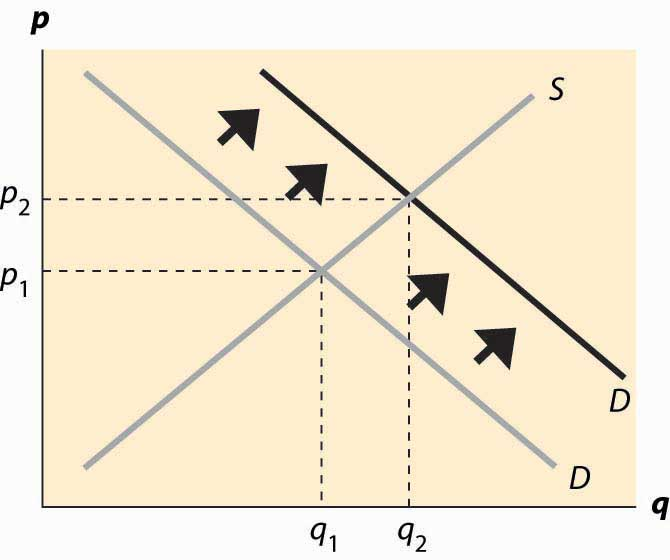
This diagram shows an increase in demand as a rightward shift of the entire demand curve (from the lighter demand curve to the darker one). With supply held constant, the new intersection occurs at a higher equilibrium price and higher equilibrium quantity (from to ). This visually reinforces the idea that shifts come from non-price determinants, not from a change in the good’s own price. Source
Core determinants that shift demand
Changes in these factors shift the entire demand curve (not along it):
Income
For normal goods, higher income increases demand (right shift).
For inferior goods, higher income decreases demand (left shift).
Tastes and preferences
Trends, advertising, and changing attitudes can raise or lower demand.
Expectations
If consumers expect higher future prices or higher future income, current demand often increases.
Prices of related goods
Substitutes: if the price of a substitute rises, demand for this good increases.
Complements: if the price of a complement rises, demand for this good decreases.
Number of buyers
Population changes, demographic shifts, or market access can shift demand.
What “holding other factors constant” really means
A demand curve is drawn under ceteris paribus assumptions: income, tastes, related-good prices, expectations, and buyer numbers are treated as fixed. When any of these change, the original curve no longer applies, so the curve must shift.
Common interpretation mistakes to avoid
A change in the good’s own price changes quantity demanded (movement along), not demand.
A “demand increase” must be tied to a specific determinant changing (for example, income or preferences), not simply to “people buying more” without a cause.
Market demand can change even if each individual’s demand is unchanged (for example, when the number of buyers changes).
Practice Questions
(2 marks) Define market demand and state how it is derived from individual demand schedules.
1 mark: Correct definition: total quantity demanded by all buyers at each price.
1 mark: Derived by horizontally summing individual quantities at each price (adding individual demand schedules).
(6 marks) The market for bottled water has many buyers. (a) Explain how an increase in the number of buyers affects market demand. (b) Explain how a fall in the price of reusable water bottles (a substitute) affects demand for bottled water. Use correct shift language.
(a) 1 mark: More buyers increases market quantity demanded at each price.
(a) 1 mark: Market demand shifts right.
(a) 1 mark: Explanation links to horizontal summation/adding more individual demands.
(b) 1 mark: Reusable bottles are a substitute for bottled water.
(b) 1 mark: Lower substitute price reduces demand for bottled water at each price.
(b) 1 mark: Demand for bottled water shifts left (not a movement along the curve).
FAQ
Group buyers by the price they actually pay.
Then aggregate by adding quantities demanded across groups at each relevant effective price; the “market demand curve” may be pieced together from segments.
Different consumers enter/exit the market at different prices.
At some prices, many marginal buyers respond (flatter section); at others, only a few remain responsive (steeper section).
Not necessarily.
If consumers cannot purchase desired quantities at the posted price, observed purchases reflect constraints; the measured “demand” may understate underlying willingness to buy.
State the determinant that changed, then say: “At every price, quantity demanded is higher/lower.”
Finish with direction: “So demand shifts right/left.”
Yes.
If the number of buyers decreases enough (e.g., population outflow), total market quantity demanded at each price can fall despite stronger remaining individual demands.
