
AP Syllabus focus: ‘Price elasticity of demand depends on factors such as the availability of substitutes, and price changes affect total revenue differently across elasticity ranges.’
Price elasticity of demand helps predict how buyers respond to price changes and, therefore, how a firm’s total revenue will change. This page links key determinants of elasticity to revenue outcomes across different elasticity ranges.
Determinants of Price Elasticity of Demand
Price elasticity of demand is shaped by how easily and quickly consumers can adjust their purchasing.
Availability of substitutes (most important)
More and closer substitutes make demand more elastic because consumers can switch away when price rises.
Many close substitutes (e.g., similar brands) → highly elastic
Few substitutes (unique product) → inelastic
Necessities vs luxuries
Necessities tend to have more inelastic demand; luxuries tend to be more elastic.
Necessities: consumers keep buying despite price increases
Luxuries: consumers can delay, downgrade, or go without
Share of income (budget proportion)
Goods that take a large fraction of income usually have more elastic demand, since a price change meaningfully affects the budget.
Big-ticket items → more elastic
Small, inexpensive items → more inelastic
Time horizon (time to adjust)
Demand is typically more elastic in the long run because consumers have more time to find substitutes or change habits.
Short run: limited adjustment options → more inelastic
Long run: switching, relocating, changing routines → more elastic
Definition of the market (narrow vs broad)
A narrowly defined good tends to have more substitutes and therefore more elastic demand.
“Soft drinks” (broad) → fewer substitutes overall → less elastic
“Cola from one brand” (narrow) → many alternatives → more elastic
Brand loyalty, habits, and addiction
Stronger loyalty or dependence reduces responsiveness to price changes, making demand more inelastic. Advertising and product differentiation often aim to reduce perceived substitutability.
Total Revenue and Elasticity
Total revenue connects the firm’s price decision to market responsiveness.
Total revenue (TR): The money a seller receives from sales, equal to price times quantity sold.
A price change has two opposing effects on total revenue: the price effect (higher price raises revenue per unit) and the quantity effect (higher price reduces units sold). Elasticity determines which effect dominates.
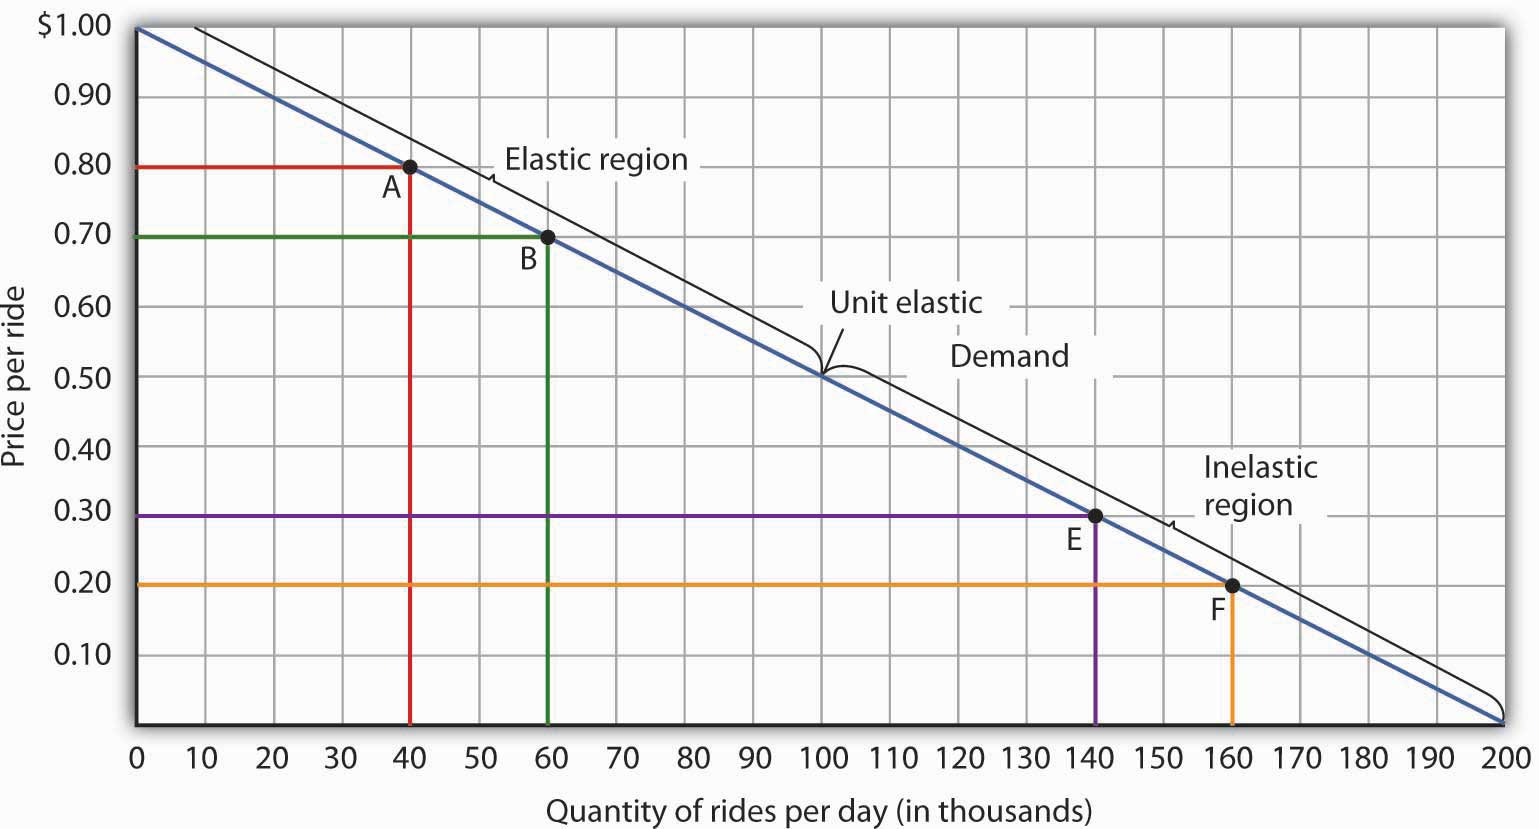
This diagram uses revenue rectangles () on a straight-line demand curve to show how total revenue changes when price changes. In the elastic range (upper portion of the demand curve), lowering price increases ; in the inelastic range (lower portion), lowering price decreases . The rectangle area is largest at the unit-elastic midpoint, where is maximized. Source
= Total revenue, dollars per period
= Price per unit, dollars per unit
= Quantity sold, units per period
The total revenue test (elasticity ranges)
Use the elasticity range to predict how price and total revenue move together.
Elastic demand ()
Price and total revenue move in opposite directions
A price decrease raises TR; a price increase lowers TR
Inelastic demand ()
Price and total revenue move in the same direction
A price increase raises TR; a price decrease lowers TR
Unit elastic demand ()
Total revenue is unchanged when price changes
Why elasticity changes along a straight-line demand curve
Even if the demand curve is linear, elasticity is not constant because elasticity depends on percentage changes.
At high prices / low quantities, percentage quantity changes tend to be large → demand is more elastic
At low prices / high quantities, percentage quantity changes tend to be small → demand is more inelastic
The midpoint is where demand is unit elastic, and TR is maximised on a linear demand curve
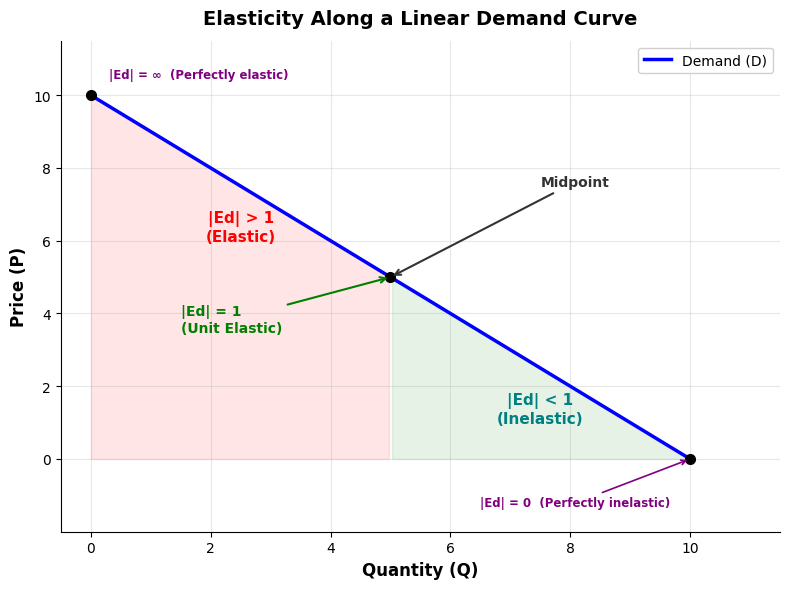
This graph labels the elastic, unit-elastic, and inelastic regions along a single straight-line demand curve, highlighting that elasticity changes even when slope is constant. The upper-left region (high price/low quantity) is elastic because percentage changes in quantity are large relative to percentage price changes. The midpoint is unit elastic, and the lower-right region becomes inelastic as percentage quantity changes shrink. Source
Linking determinants to revenue decisions
Determinants guide how confidently a seller can raise price without losing too many sales.
If substitutes are plentiful or the good is a luxury, demand is likely elastic, so price increases risk lowering TR.
If the good is a necessity, strongly habitual, or small in the budget, demand is more inelastic, so price increases are more likely to raise TR.
Over time, even initially inelastic demand can become more elastic as consumers adjust, changing the long-run TR impact of a price change.
Practice Questions
(2 marks) If demand for a product is price inelastic, explain what happens to total revenue when the firm increases price.
States that total revenue increases when price rises with inelastic demand (1)
Correct explanation: percentage fall in quantity demanded is smaller than percentage rise in price, so rises (1)
(6 marks) Explain how (i) availability of substitutes, (ii) proportion of income, and (iii) time horizon affect price elasticity of demand, and relate each factor to the likely effect of a price increase on total revenue.
Substitutes: more/closer substitutes → more elastic demand (1); therefore a price rise is more likely to reduce total revenue (1)
Proportion of income: larger budget share → more elastic demand (1); therefore a price rise is more likely to reduce total revenue (1)
Time horizon: demand more elastic in the long run than short run (1); therefore a price rise is more likely to reduce total revenue in the long run than in the short run (1)
FAQ
They can reduce perceived substitutability through differentiation and switching costs, for example:
Loyalty programmes or subscriptions that raise the cost of switching
Branding/advertising that increases perceived uniqueness
Bundling features or services that competitors do not match
If consumers see fewer close substitutes, responsiveness to price changes falls.
A narrow definition isolates a product with many nearby alternatives. Consumers can substitute within the broader category, so a price rise triggers switching.
For instance, a specific brand within a category typically has more substitutes than the entire category.
Durable goods often become more elastic over time because consumers can:
Postpone replacement
Repair existing items
Buy used or rent/lease instead
These adjustment margins expand with time, increasing long-run responsiveness.
Yes, they often use indicators such as:
Competitor price matching frequency
Customer surveys on “second choice” products
Market share shifts after small price differences
Online search and comparison-shopping intensity
These clues reflect how easily buyers switch.
Higher switching costs usually make demand more inelastic in the relevant price range, so a price rise is more likely to increase total revenue.
However, if switching costs fall (e.g., contracts end, new platforms appear), demand may become more elastic and reverse the revenue effect.
