
AP Syllabus focus: ‘Elasticity can be measured for any determinant of demand or supply, not only for price.’
Elasticity is a general tool for comparing responsiveness across markets and scenarios.
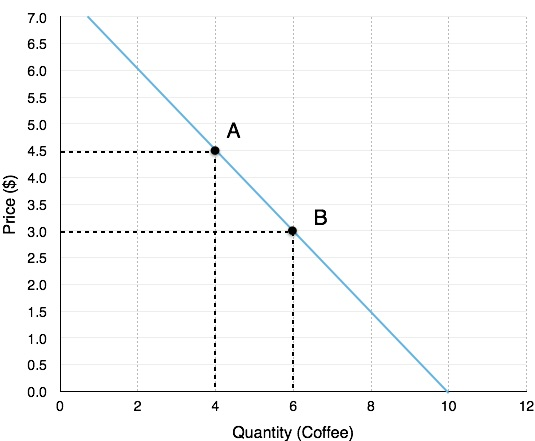
A linear demand curve with two marked points (A and B) used to compare percentage changes in price and quantity along the curve. The diagram is useful for emphasizing that elasticity is fundamentally a ratio of percent changes, not a slope measured in units. You can mentally relabel the horizontal/vertical change as a change in any determinant and the corresponding change in to match the general elasticity definition. Source
In AP Microeconomics, it extends beyond price to quantify how strongly quantity changes when any relevant determinant changes.
Core idea: elasticity is a general responsiveness measure
What elasticity measures
Elasticity compares a percentage change in quantity to a percentage change in some determinant (a variable that influences buyers’ or sellers’ decisions). Because it uses percentages, elasticity is unit-free, making comparisons meaningful across different goods.
Elasticity: the ratio of the percentage change in quantity (demanded or supplied) to the percentage change in a chosen determinant.
Elasticity is not restricted to price. You can define an elasticity with respect to any variable that shifts demand or supply, such as income, the price of another good, input costs, taxes, or expectations.
General elasticity formula (beyond price)
Elasticity\ of\ Q\ with\ respect\ to\ X\ (E_{Q,X})=\dfrac{%\Delta Q}{%\Delta X}
= Quantity demanded or quantity supplied (units of the good per time period)
= Any determinant of demand or supply (measured in its own units, such as dollars, an index value, or a tax rate)
In words, answers: “If rises by 1%, by what percent does change?”
How to interpret elasticity values
Magnitude: strength of responsiveness
The absolute value (how far the number is from zero) indicates responsiveness.
If : quantity is relatively responsive to changes in (elastic with respect to ).
If : quantity is relatively unresponsive to changes in (inelastic with respect to ).
If : unit responsiveness.
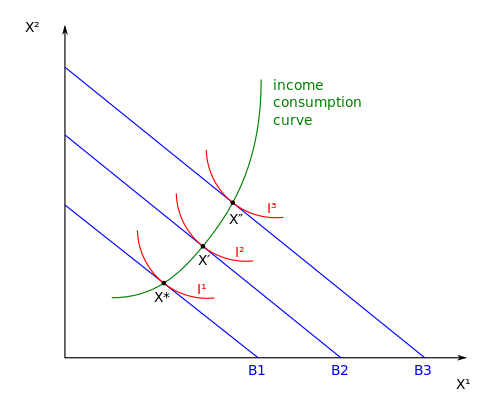
A labeled summary graph that classifies goods by income elasticity of demand (YED), distinguishing inferior goods (negative), necessities (), and luxury goods (). It visually ties together both magnitude and sign, showing that elasticity interpretation is not limited to price. This is especially helpful when is income, where the sign directly indicates whether the good is normal or inferior. Source
This interpretation works the same way whether is price or a non-price determinant.
Sign: direction of the relationship
The sign tells whether moves with or against .
Positive elasticity (): increases when increases (direct relationship).
Negative elasticity (): decreases when increases (inverse relationship).
For non-price elasticities, the sign is especially informative because different determinants can push quantity in either direction.
What counts as “beyond price” determinants?
Determinants linked to demand
Elasticity can be defined for any variable that shifts demand (changes buyers’ willingness and ability to purchase), including:
Income
Prices of related goods
Preferences/tastes
Expected future prices
Number of buyers
The key skill is recognising that the same structure applies: percent change in quantity demanded relative to percent change in the determinant.
Determinants linked to supply
Elasticity can also be defined for variables that shift supply (changes sellers’ costs or incentives), including:
Input prices (wages, raw materials, energy)
Technology/productivity
Taxes/subsidies affecting production incentives
Number of sellers
Expected future prices (which can affect current selling decisions)
Even when a determinant is not measured in dollars (for example, a technology index), elasticity still works because it uses percentage changes.
Why elasticity beyond price is useful in microeconomics
Comparability across markets and policies
Because it is unit-free, a non-price elasticity helps compare responsiveness across:
Different goods (where quantities and measurement units differ)
Different policy contexts (for example, how strongly quantity responds to a tax rate change versus an income change)
Distinguishing “direction” from “strength”
A shift variable can move quantity up or down (sign), and it can do so weakly or strongly (magnitude). Elasticity separates these ideas cleanly:
Sign communicates whether the determinant increases or decreases quantity.
Magnitude communicates how sensitive quantity is to that determinant.
Clarifying that slope is not the same concept
Elasticity is based on percent changes, not the steepness of a curve measured in units. For non-price determinants, this matters because the determinant may not even be on the graph; elasticity still provides a consistent responsiveness measure.
Practice Questions
(2 marks) Define an elasticity “beyond price” and state what the sign of the elasticity tells you.
1 mark: Correct definition as where is any determinant (not necessarily price).
1 mark: Sign interpretation (positive = direct relationship; negative = inverse relationship).
(6 marks) A government is evaluating how quantity sold changes when (i) household income changes and (ii) a per-unit production tax changes. Explain how elasticity can be used to compare responsiveness in these two cases. Include a general elasticity expression and explain how to interpret both magnitude and sign.
1 mark: States elasticity uses percentage changes, making it unit-free/comparable.
1 mark: Provides correct general expression .
2 marks: Explains magnitude using thresholds (, , ) as stronger/weaker responsiveness.
2 marks: Explains sign meaning (direct vs inverse) applied to determinants (income or tax), without requiring numeric calculation.
FAQ
Yes, as long as the index can change by a percentage. Elasticity uses $%\Delta X$, so any determinant measured on a scale where percentage changes are meaningful can be used.
Percentages standardise changes across units. A “$1” change, a “1-point” index change, and a “1%” change are not comparable, but percentage changes make responsiveness comparable.
Percentage changes may be undefined or misleading when the base value is zero, and sign conventions can become confusing if the determinant crosses zero. In practice, economists choose measures and ranges where $%\Delta X$ is interpretable.
Not necessarily. Elasticity is about percentage responsiveness. A market can have a high elasticity but small unit changes if the starting quantity is small (or vice versa).
Only with care. Responsiveness can differ in the short run versus long run because buyers and sellers may have more time to adjust behaviour, contracts, or production methods, changing the observed elasticity.
