
AP Syllabus focus: ‘Equilibrium price guides resource allocation, while consumer surplus and producer surplus measure the benefits markets create for buyers and sellers.’
Prices in competitive markets do more than set what buyers pay and sellers receive. They also help allocate scarce resources and let us measure how much value trade creates for each side.
Surplus and the value created by markets
When a market reaches equilibrium, buyers with the highest willingness to pay purchase units from sellers with the lowest costs (as reflected in the supply curve). The gap between what each side would be willing to accept and the actual market price generates surplus.
Consumer surplus (CS)
Consumer surplus: The difference between a buyer’s willingness to pay and the market price, summed across all units purchased; the net benefit to buyers.
CS exists because many consumers would have paid more than the equilibrium price for at least some units, but competition allows them to buy at the same market price. Graphically, CS is the area under the demand curve and above the market price, up to the quantity purchased.
Producer surplus (PS)
Producer surplus: The difference between the market price and the minimum price sellers would accept (their marginal cost as reflected by supply), summed across all units sold; the net benefit to sellers.
PS exists because many producers would have been willing to sell for less than the market price for initial units, but receive the same market price on all units sold. Graphically, PS is the area above the supply curve and below the market price, up to the quantity sold.
A key AP skill is identifying these areas correctly on a supply-and-demand graph.
= willingness to pay per unit (dollars per unit)
= market price (dollars per unit)
= marginal cost per unit (dollars per unit)
On a standard graph, these sums correspond to areas formed by the demand curve, supply curve, price line, and the traded quantity.
Total economic surplus and what it measures
Total surplus: The sum of consumer surplus and producer surplus; the total net benefit created by market exchange for buyers and sellers.
Total surplus is a benefit measure, not a cash flow measure. It captures gains from trade generated because buyers’ marginal benefits exceed sellers’ marginal costs for units that are actually traded.
Equilibrium price as a resource-allocation signal
The equilibrium price helps determine:
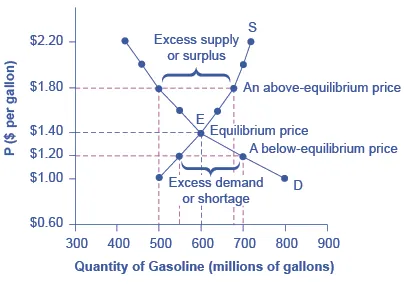
This figure shows the market equilibrium where supply and demand intersect, and it also labels what happens when price is set above equilibrium (excess supply) or below equilibrium (excess demand). By contrasting these cases on the same axes, the graph clarifies why the equilibrium price coordinates buyers’ and sellers’ decisions. It is a visual reminder that equilibrium price is the key signal aligning quantity demanded with quantity supplied. Source
Which buyers get the good: those willing and able to pay the price (reflecting relatively higher marginal benefits).
Which sellers produce: those able to cover costs at that price (reflecting relatively lower marginal costs).
How many units are produced and consumed: the equilibrium quantity where the market balances.
In this way, equilibrium price guides resource allocation by directing productive resources (labour, capital, raw materials) toward goods with stronger demand relative to available supply, and away from goods with weaker demand relative to supply. Changes in market conditions that alter demand or supply change the equilibrium price, which then updates incentives for consumers and producers.
Reading CS and PS on a graph (AP essentials)
Identify equilibrium and from the intersection of supply and demand.
CS: start at , trace the demand curve down to ; take the area above the price line.
PS: start at , trace the supply curve up to ; take the area below the price line.
CS and PS depend on both price and quantity traded; focusing on price alone can be misleading if quantity changes.
Practice Questions
(2 marks) Define consumer surplus and explain how it is shown on a demand-and-supply diagram.
1 mark: Correct definition: difference between willingness to pay and market price, summed over units purchased.
1 mark: Correct diagram description: area under demand curve and above market price up to the quantity bought ().
(6 marks) In a competitive market at equilibrium price and quantity : (a) Explain how the equilibrium price guides resource allocation between consumers and producers. (3 marks) (b) Explain what producer surplus measures and identify it on a standard diagram. (3 marks)
1 mark: Price rations the good to buyers willing/able to pay (higher marginal benefit).
1 mark: Price attracts/keeps producers who can supply at that price (lower marginal cost).
1 mark: The resulting determines how many resources are devoted to producing the good. (b)
1 mark: Definition: difference between market price and minimum acceptable price/marginal cost, summed over units sold.
1 mark: Identifies area on graph: above supply curve and below price line up to .
1 mark: Interprets as net benefit to sellers (not simply revenue).
FAQ
No. Producer surplus is based on marginal cost versus price and does not subtract fixed costs.
Willingness to pay is a monetary measure that lets economists compare marginal benefits across buyers using a common unit (currency).
Surplus is the sum across units of per-unit gaps: $(WTP-P)$ for buyers and $(P-MC)$ for sellers, rather than a perfectly smooth area.
Not necessarily, because the traded quantity may change; CS and PS depend on both $P$ and $Q$.
It suggests marginal willingness to pay is close to price for most purchased units (demand is not far above the price at $Q^*$).
