
AP Syllabus focus: ‘International trade changes consumer surplus, producer surplus, and total economic surplus in competitive markets.’
International trade links domestic buyers and sellers to the world market, changing the price faced at home. Those price changes redistribute surplus between consumers and producers and typically increase overall gains from voluntary exchange.
Core idea: trade changes the price, which changes surplus
In a perfectly competitive market, opening to trade means the domestic market price tends to move toward the world price. The key comparison is between:
the autarky equilibrium (no trade) domestic price and quantity, and
the domestic outcome when trade is allowed at the world price.
When the domestic price changes, the sizes of consumer surplus and producer surplus change because different units are purchased/produced and at different prices.
Economic surplus measures used in trade analysis
Consumer surplus (CS): the difference between what consumers are willing to pay (demand) and what they actually pay, summed over units purchased.
Consumer surplus is typically shown as the area under the demand curve and above the market price, up to the quantity consumed.
Producer surplus (PS): the difference between the market price producers receive and their minimum willingness to accept (supply), summed over units produced.
Producer surplus is typically shown as the area above the supply curve and below the market price, up to the quantity produced.
Total economic surplus and gains from trade
Total economic surplus is the combined benefit to buyers and sellers from market exchange. Trade can create gains from trade by allowing more mutually beneficial transactions than under autarky.
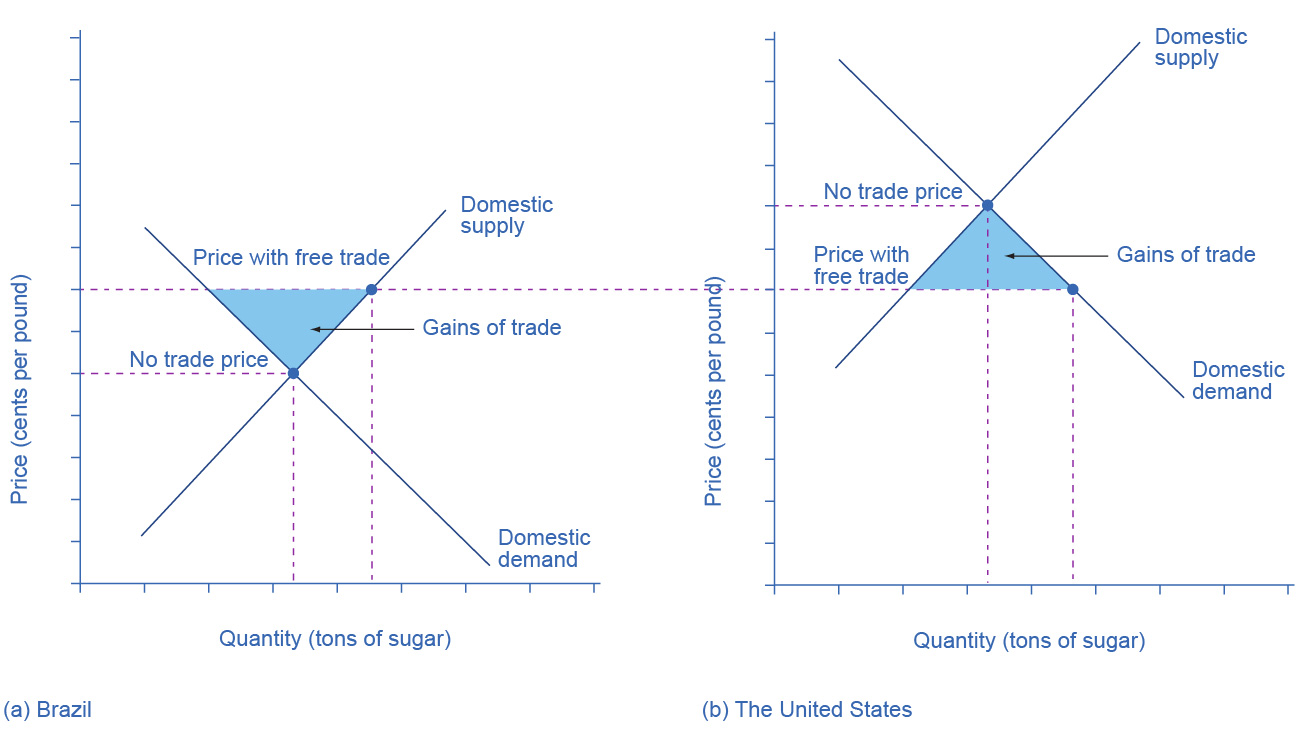
This two-panel diagram illustrates that total surplus rises with free trade in both an importing country and an exporting country, while the distribution differs: consumers tend to gain in the importing country and producers tend to gain in the exporting country. The shaded regions visualize the increase in social surplus under trade relative to autarky. It’s helpful for connecting the surplus-area story to the “imports vs. exports” cases conceptually. Source
= total economic surplus, measured in dollars of net benefit
= consumer surplus, dollars
= producer surplus, dollars
A change in TS captures whether the economy’s overall net benefits rise or fall when trade is introduced.
Imports vs exports: how the world price determines the outcome
If the world price is below the autarky price (the country imports)
A lower price increases quantity demanded and decreases quantity supplied domestically.
Consumers gain: CS increases because price falls and consumption rises.
Producers lose: PS decreases because price falls and domestic output shrinks.
Total surplus typically rises: additional consumption includes units that create net benefits at the lower world price, and resources shift away from higher-cost domestic production.
Imports fill the gap:
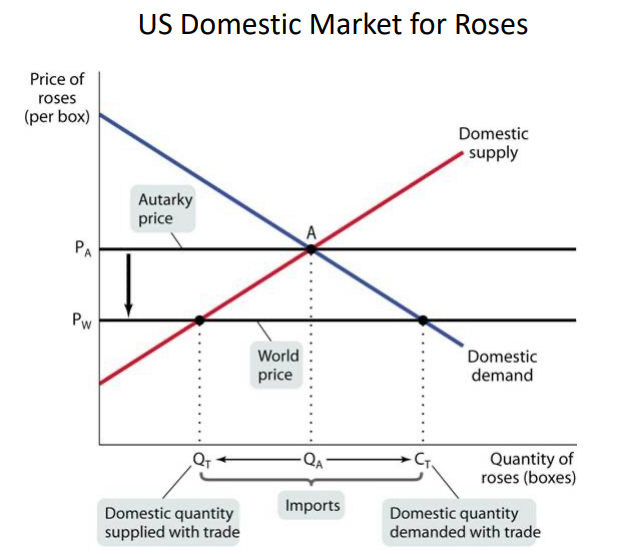
A standard small-country trade graph for the importing case: the world price is below the autarky equilibrium price . At , domestic producers supply less and domestic consumers demand more, and the horizontal distance between those quantities is labeled as imports. This picture reinforces how opening to trade changes the domestic price and therefore reallocates output and consumption. Source
Imports = quantity demanded at world price − quantity supplied at world price.
If the world price is above the autarky price (the country exports)
A higher price decreases quantity demanded and increases quantity supplied domestically.
Consumers lose: CS decreases because price rises and consumption falls.
Producers gain: PS increases because price rises and domestic output expands.
Total surplus typically rises: production expands where the world price covers marginal cost, and the country sells more in higher-value uses abroad.
Exports fill the gap:
Exports = quantity supplied at world price − quantity demanded at world price.
Reading the surplus changes on a standard trade graph
On the familiar supply-and-demand diagram:
Autarky CS and PS are the areas relative to the autarky price.
With trade, CS and PS are recalculated relative to the world price and the new quantities consumed/produced.
The net welfare gain from trade is the increase in TS (the “extra” area created by moving from autarky to the world-price outcome).
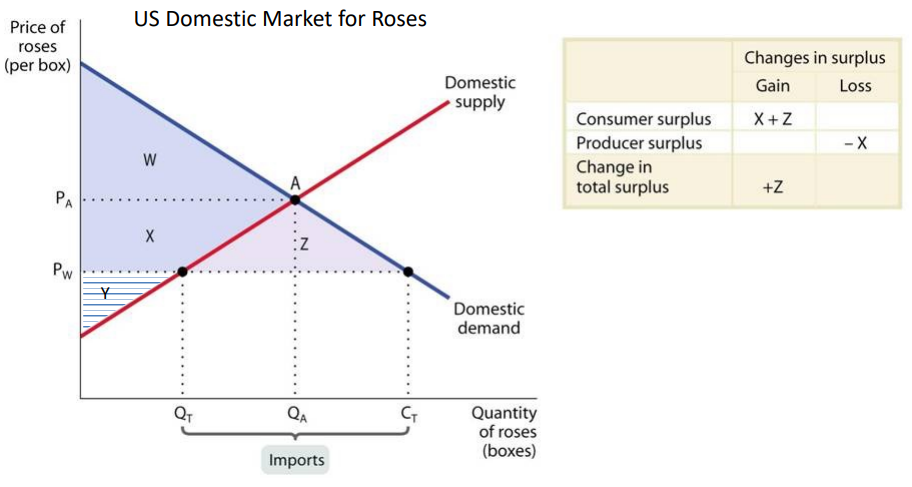
The import case is decomposed into labeled areas showing how surplus changes when the price falls from (autarky) to (world price). The figure highlights that consumer surplus increases, producer surplus decreases, and the net gain in total surplus is the additional triangle created by shifting consumption/production toward units with positive net benefits at the world price. This is the standard AP Micro “area” interpretation of gains from trade. Source
A useful way to think about the net gain is that trade:
expands exchanges that were previously blocked by an unfavourable domestic price, and
reallocates production toward lower opportunity cost sources (domestic or foreign), increasing total economic surplus.
Practice Questions
(2 marks) In a market that opens to trade, the world price is below the domestic autarky price. State what happens to consumer surplus and producer surplus.
Consumer surplus increases (1)
Producer surplus decreases (1)
(6 marks) A country opens a perfectly competitive market to international trade and becomes an exporter because the world price is higher than the autarky equilibrium price. Explain how consumer surplus, producer surplus, and total economic surplus change, and identify the source of any net gain.
World price above autarky price implies exports: quantity supplied rises and quantity demanded falls (1)
Consumer surplus falls due to higher price and reduced domestic consumption (1)
Producer surplus rises due to higher price and expanded domestic production (1)
Total economic surplus increases overall (1)
Net gain comes from additional mutually beneficial trades at the world price / reallocating output toward lower opportunity cost uses (1)
Recognition that gains are measured as the increase in (1)
FAQ
Trade changes the price, so it redistributes surplus between groups.
Total surplus can still increase because the gains to winners can exceed the losses to losers, reflecting additional mutually beneficial transactions at the world price.
If the world price is very close to the autarky equilibrium price, the domestic price and quantities barely change.
In that case, changes in CS, PS, and TS are small because consumption and production patterns remain similar.
A small country takes the world price as given; its trade volume does not affect that price.
This makes the domestic price under trade effectively fixed at the world price, simplifying the CS/PS comparison versus autarky.
Elasticities shape how much quantities adjust when the domestic price moves to the world price.
More elastic curves typically imply larger quantity changes
Larger quantity changes often correspond to larger changes in CS/PS and potentially larger gains from trade
With a higher world price, firms expand output because more units are profitable at the margin.
Producers receive the higher price on units sold, raising PS, while domestic consumers reduce purchases because the higher price lowers quantity demanded.
