
AP Syllabus focus: ‘Opening an economy to trade can raise or lower equilibrium price relative to autarky, and trade fills the gap between domestic supply and demand.’
International trade can be analysed with the familiar supply-and-demand model by comparing a country’s domestic (autarky) equilibrium price to the world price. This comparison predicts whether the country imports or exports and by how much.
Autarky (No Trade) and Domestic Equilibrium
In autarky, the market outcome is determined only by domestic buyers and domestic sellers. The equilibrium price and equilibrium quantity occur where domestic quantity demanded equals domestic quantity supplied.
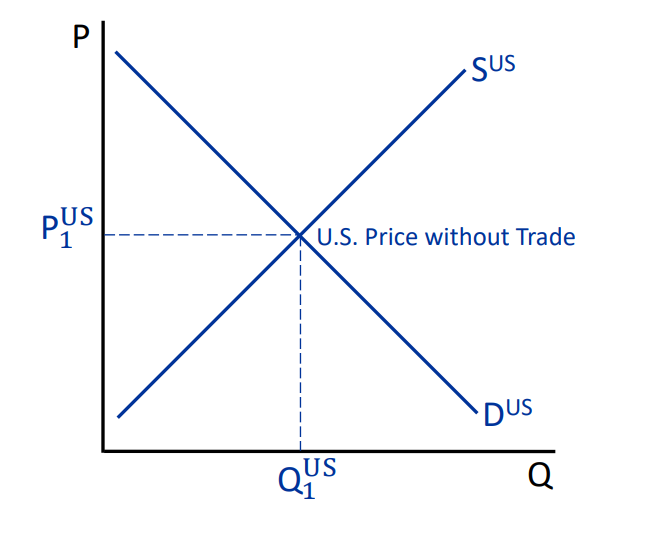
A standard autarky equilibrium diagram: domestic demand and domestic supply intersect at the no-trade price and quantity. The dashed lines project the equilibrium point to the axes, reinforcing how to read and directly from the intersection. This provides the reference point needed before comparing autarky to the world price under trade. Source
Autarky: a situation in which a country does not trade a good with other countries; the domestic price and quantity are set only by domestic supply and demand.
When analyzing autarky on a graph:
Find the intersection of domestic demand (D) and domestic supply (S).
Read the autarky equilibrium price and autarky equilibrium quantity at that intersection.
Opening to Trade: The World Price as the New Reference Point
With trade, the key comparison is between the domestic autarky price and the world price for the good. For a country that is a price taker in world markets, the world price is treated as given.
World price: the price at which a good can be bought or sold on the international market.
On a standard graph, the world price is shown as a horizontal line at :
Domestic buyers can purchase at .
Domestic sellers can sell at (either at home or abroad).
If the world price is below the autarky price: the country imports
If :
Domestic consumers face a lower price, so quantity demanded rises.
Domestic producers receive a lower price, so quantity supplied falls.
Because exceeds at , the country becomes an importer.
Imports: units of a good purchased from foreign producers when domestic quantity demanded exceeds domestic quantity supplied at the market price.
If the world price is above the autarky price: the country exports
If :
Domestic producers receive a higher price, so quantity supplied rises.
Domestic consumers face a higher price, so quantity demanded falls.
Because exceeds at , the country becomes an exporter.
Exports: units of a good sold to foreign buyers when domestic quantity supplied exceeds domestic quantity demanded at the market price.
“Trade Fills the Gap” Between Domestic Supply and Demand
Once the price is set at , domestic quantity demanded and domestic quantity supplied generally differ. International trade fills the gap:
When , the difference is filled by imports.
When , the difference is sold as exports.
A useful way to express the traded quantity is:
= domestic quantity demanded at the world price (units)
= domestic quantity supplied at the world price (units)
= domestic quantity supplied at the world price (units)
= domestic quantity demanded at the world price (units)
This framework highlights that trade changes not just the price, but also reallocates production and consumption:
Imports allow domestic consumption to exceed domestic production.
Exports allow domestic production to exceed domestic consumption.
Graph-and-Logic Checklist (No Numbers Required)
Identify the domestic S and D curves and the autarky equilibrium.
Introduce the horizontal world price line at .
Compare to the autarky price to decide importer vs exporter.
Read and at .
The horizontal distance between and at is the quantity traded (imports or exports).
Practice Questions
(2 marks) In a market for coffee, the world price is below the domestic autarky equilibrium price. State whether the country imports or exports coffee, and explain why.
Identifies the country imports coffee (1)
Explains that at the lower world price, rises and/or falls so , with the gap filled by imports (1)
(6 marks) A country opens to trade in wheat. The world price is above the domestic autarky equilibrium price. Using a supply-and-demand diagram description (no calculations), explain: (a) how the domestic price changes (1 mark), (b) how domestic quantity demanded and supplied change (2 marks), (c) whether the country imports or exports and how the traded quantity is found on the graph (3 marks).
(a) Domestic price rises to (1)
(b) falls at the higher price (1); rises at the higher price (1)
(c) Country exports (1); exports equal (1); traded quantity is the horizontal gap between and at (1)
FAQ
It assumes the country is “small” in the world market for that good, so its trade does not affect $P_w$.
It also assumes the good is standardised enough that a single international price is meaningful.
Transport costs create a wedge between the foreign price and the effective price faced domestically.
Trade occurs only if the difference between the autarky price and the foreign price is large enough to cover these costs.
Yes. If $P_w$ equals the autarky equilibrium price, then $Q_d(P_w)=Q_s(P_w)$ and the quantity traded is zero.
In that case, opening to trade does not change the market outcome.
Differences can arise from product quality, timing, contracting, and local distribution costs.
Exchange-rate movements can also change the domestic-currency price of the same world-market transaction.
If a good is non-tradable (e.g., due to perishability or high shipping costs), then $P_w$ is not a relevant benchmark.
The market outcome remains effectively autarkic because trade cannot fill any domestic gap between $Q_d$ and $Q_s$.
