
AP Syllabus focus:
‘Detaling the calculation of standardized scores, including the formula for z-scores: z=(x−µ)/σ, where x is the data value, µ is the mean, and σ is the standard deviation.
- Emphasizing the role of z-scores in measuring how many standard deviations a data value is from the mean, facilitating comparisons within and across data sets.
- Skill 3.A: Enhancing skills in determining proportions and percentiles from a normal distribution through the use of z-scores and standardized scores.’
Standardized scores, or z-scores, provide a crucial method for comparing values within a distribution by translating raw data into a common scale based on variability and position.
Understanding Standardized Scores in Context
Z-scores allow statisticians to interpret how unusual or typical a data value is relative to the overall distribution. Because standardized scores rely on both the mean and standard deviation, they convert raw data into units of standard deviation, making comparisons intuitive even across different datasets.
When working with normally distributed variables, z-scores become especially powerful for connecting individual observations to proportions or percentiles of the distribution. This aligns closely with the AP Statistics requirement that students use standardized scores to determine areas under the normal curve.
The Purpose of Z-Scores
Z-scores serve several important purposes in statistical analysis:
Allowing comparisons of scores from different distributions by using a shared standardized scale.
Measuring relative position, indicating how far and in which direction a value deviates from its mean.
Providing access to probability-based interpretations using the standard normal distribution.
Supporting the determination of percentiles or proportions for normally distributed variables.
Because z-scores quantify variation in a consistent way, they form a foundational tool for statistical reasoning.
The Structure of a Z-Score
A z-score stems from the relationship between a data value and the distribution it belongs to. It reflects both direction and magnitude, where the sign indicates whether the data value lies above or below the mean.
EQUATION
= Standardized score (in standard deviation units)
= Observed data value
= Population mean
= Population standard deviation
A standardized score interprets the distance between a value and the mean in terms of the number of standard deviations. This allows students to articulate how extreme or ordinary a value is within context.
When we standardize a normally distributed variable, we obtain the standard normal distribution, which has mean 0 and standard deviation 1.
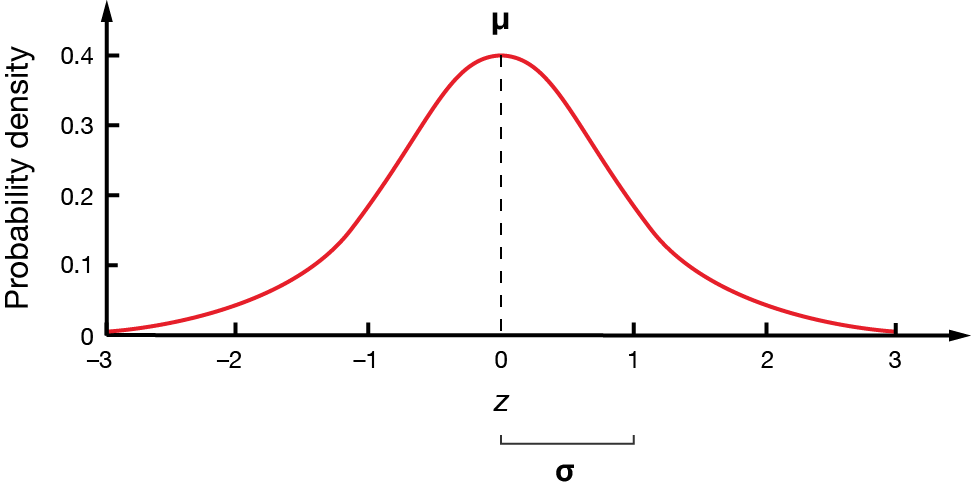
This figure shows the standard normal distribution with the mean at 0 and the horizontal axis measured in z-scores, illustrating that each unit on the axis represents one standard deviation from the mean. Source.
Interpreting the Meaning of a Z-Score
Interpreting z-scores requires attention to both magnitude and sign. A positive z-score indicates a value higher than the mean, while a negative z-score signifies a value below the mean. The larger the absolute value, the more unusual the observation relative to the distribution.
Key interpretive principles include:
z = 0: The data value is exactly at the mean.
Positive z-scores: Indicate above-average observations.
Negative z-scores: Indicate below-average observations.
Large absolute values: Suggest extreme or potentially rare observations, particularly in a normal distribution.
Because standardized scores rely on population parameters, they assume the context of the distribution is known. This aligns with the AP focus on developing skill in interpreting the standardized distance from the mean.
Z-Scores and the Standard Normal Distribution
The standard normal distribution is a special case of the normal distribution with mean 0 and standard deviation 1. When a raw score is converted into a z-score, its placement within the standard normal curve becomes clearly defined. This relationship enables students to use the standardized scale to determine proportions or percentiles.
Standard Normal Distribution: A normal distribution with mean 0 and standard deviation 1 used as a reference for interpreting standardized scores.
The standard normal curve helps connect standardized values to areas under the curve, which correspond to probabilities. Students can access these probabilities using technology, normal tables, or calculator functions, as emphasized in the specification.
Using Z-Scores to Determine Proportions and Percentiles
Z-scores serve as the bridge between raw data and probability-based interpretations. Once a data value is standardized, it can be associated with a cumulative proportion on the standard normal curve.
This connection makes it possible to:
Determine the proportion of observations below a given z-score.
Find the proportion between two z-scores.
Identify the percentile rank associated with a data value.
Translate percentiles back into raw data values when needed.
These applications directly support Skill 3.A, which requires students to use z-scores to determine proportions and percentiles in normally distributed contexts.
Comparing Values Across Different Distributions
Because z-scores place observations from any normal distribution onto a shared standard scale, they offer a reliable method for comparing results drawn from different populations or measurement units.
Important advantages include:
Cross-context comparison: Values from distinct datasets become comparable using standardized distance.
Unitless interpretation: Standard deviation units replace original measurement units, promoting clarity.
Fair evaluation: Particularly useful in contexts like test scores or performance metrics.
This comparability reinforces the AP emphasis on understanding relative standing through standardized measures.
The Importance of Context When Interpreting Z-Scores
While z-scores provide a statistical foundation for comparison, interpretation must remain grounded in context. Understanding whether a z-score is meaningful, unusual, or important depends on the situation described by the dataset.
Contextual interpretation includes:
Considering the shape and appropriateness of the normal model.
Evaluating whether extreme values reflect meaningful deviations.
Recognizing the practical implications of standardized differences.
Because z-scores count standard deviations, values with |z| close to 0 are common in a normal model, whereas values with large positive or negative z-scores are increasingly rare.
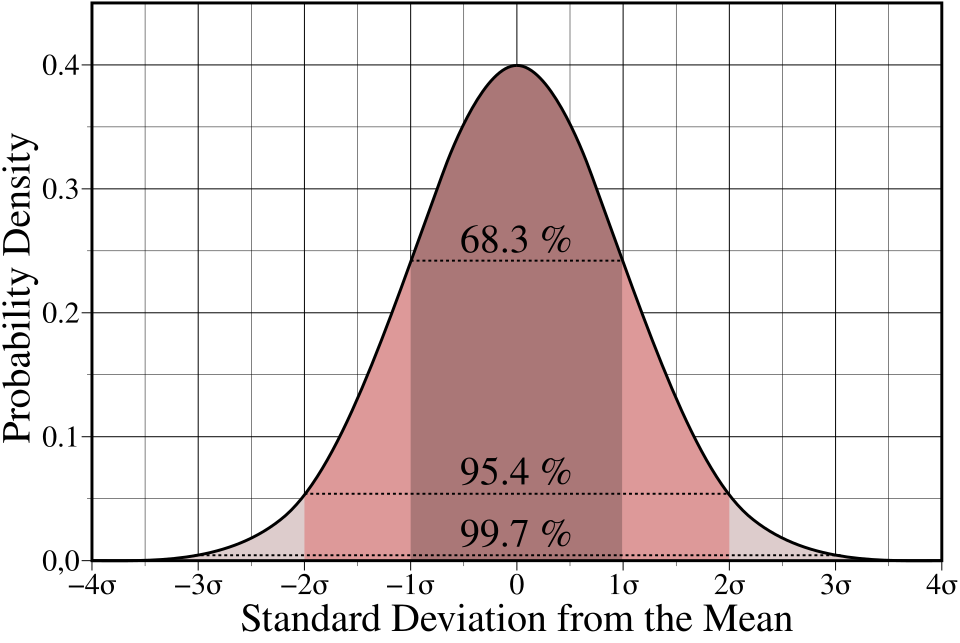
This diagram shows the standard normal curve with shaded intervals corresponding to 1, 2, and 3 standard deviations from the mean, illustrating how z-score magnitude relates to the rarity of observations. Source.
FAQ
A z-score represents how far a value lies from the mean when measured in units of standard deviation. This makes the value comparable across different settings, measurements, or populations.
In practical terms, a z-score tells you whether an observation is typical, unusually high, or unusually low relative to what is considered normal for that context.
Z-scores remove the influence of units by converting all observations into standard deviation units. This standardisation means that measurements such as height, salary, or test marks can be compared meaningfully despite using entirely different scales.
This is particularly useful when evaluating performance or outcomes across diverse metrics.
Z-scores can still be calculated for any distribution, but their interpretative power changes.
• In non-normal distributions, z-scores no longer correspond reliably to probabilities or percentiles.
• Large absolute z-scores may not indicate rarity if the data are heavily skewed or have outliers.
• In such cases, interpretation should focus on relative position rather than probability-based conclusions.
The sign indicates the direction of deviation from the mean.
• A positive z-score means the value is above the mean.
• A negative z-score means it is below the mean.
Interpretation depends on context: a negative z-score might indicate good performance (e.g., faster reaction time) or poor performance (e.g., low test score).
Z-scores rely on accurate summary statistics. Even small errors in the mean or standard deviation can shift z-scores noticeably, especially in assessments based on probability or percentiles.
For high-stakes decisions or rigorous analysis, mean and standard deviation should be calculated using complete datasets and appropriate rounding practices.
Practice Questions
Question 1 (1–3 marks)
A set of exam scores is approximately normally distributed with a mean of 72 and a standard deviation of 8.
A student scores 88 on the exam.
Calculate the student’s z-score and interpret what this value indicates about the student’s performance relative to the class.
Question 1 (3 marks total)
• 1 mark: Correct calculation of the z-score (value approximately 2).
• 1 mark: Correct statement that the score is 2 standard deviations above the mean.
• 1 mark: Appropriate interpretation that the student performed substantially better than the average student.
Question 2 (4–6 marks)
A fitness test measures reaction time (in milliseconds) for athletes. Reaction times in this test are normally distributed with a mean of 265 ms and a standard deviation of 22 ms.
a) Calculate the z-score for an athlete who records a reaction time of 230 ms.
b) Explain what this z-score tells you about the athlete’s performance.
c) A second athlete records a z-score of 1.4. Determine this athlete’s reaction time and state whether it represents a faster or slower reaction compared with the average participant.
d) Based on the context of the test, discuss why z-scores are useful for comparing athletes’ performances.
Question 2 (6 marks total)
a) (2 marks)
• 1 mark: Correct substitution into the z-score formula.
• 1 mark: Correct z-score (approximately –1.59).
b) (1 mark)
• 1 mark: Clear explanation that the athlete’s time is about 1.6 standard deviations faster (lower) than the mean.
c) (2 marks)
• 1 mark: Correct rearrangement to find the reaction time (approximately 296 ms).
• 1 mark: Correct interpretation that this athlete is slower than average because the reaction time is higher than the mean.
d) (1 mark)
• 1 mark: Appropriate explanation of the usefulness of z-scores for fair comparison, such as standardising performance across different scales or identifying unusually fast or slow reaction times.
