
AP Syllabus focus: 'A frequency table gives the number of cases falling into each category of a categorical variable.'
Frequency tables organize categorical data into a simple count-based display, making it easier to see how observations are distributed across categories and to describe the data clearly in context.
What a Frequency Table Does
A frequency table is used when data values are recorded as categories, labels, or groups. Instead of looking through a raw list of responses one by one, you organize the responses by category and count how many times each category appears. This allows you to see the overall pattern of the data more quickly.
A good frequency table turns a messy list into a clear summary. It helps you answer questions such as:
Which category appears most often?
Which category appears least often?
Are some categories much more common than others?
How many total cases were recorded?
This is one of the first and most important ways to summarize categorical data, because it focuses directly on the number of cases in each category.
Frequency table: A display that shows the number of cases falling into each category of a categorical variable.
The key idea is that a frequency table records counts, not measurements.
Essential Parts of a Frequency Table
Every frequency table should include clearly named categories and the frequency for each one. In this setting, frequency means the number of cases in that category.
The categories must be written in a way that makes the data easy to understand. Category names should be:
clear
consistent
distinct from one another
appropriate to the context
For example, if two labels really mean the same thing, they should not be counted as separate categories. Clear labeling matters because the usefulness of the table depends on accurate grouping.
Each case in the data set should be assigned to one category and counted once. That means the total of all frequencies should match the total number of cases in the data set. If the counts do not add up correctly, then the table is incomplete or contains an error.
A frequency table is not just a list of categories. It is a structured summary of how many observations belong to each category. The strength of the display comes from its simplicity: the reader can immediately see how the data are distributed across the available categories.
How to Construct a Frequency Table
Constructing a frequency table is a careful counting process. The main steps are:
Identify the categorical variable being studied.
Determine the set of categories that will be used.
Go through the data one case at a time.
Place each case into the correct category.
Count the number of cases in each category.
Check that the frequencies add to the total number of cases.
Many students find it helpful to use tally marks while counting, especially when the data set is long. Tallying reduces the chance of losing track of counts and makes it easier to verify totals before writing final frequencies.
Accuracy is especially important. A frequency table should reflect the data exactly as recorded. If categories are mixed up, counted twice, or skipped, the table will not represent the data correctly.
The construction process also requires attention to wording. If category labels are inconsistent, the final counts may be misleading. A frequency table is only as good as the classification system behind it.
How to Read and Use a Frequency Table
Once a frequency table has been created, it becomes a useful tool for describing the data in context.
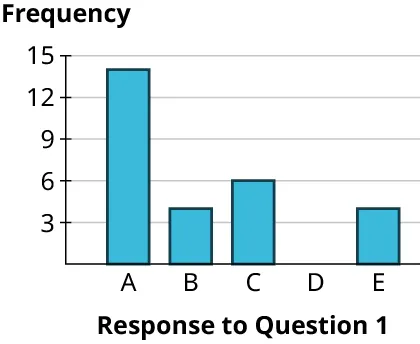
This bar chart displays a categorical frequency distribution for responses A–E. The height of each bar represents the count (frequency) in that category, making it easy to compare which categories are most and least common at a glance. Source
The frequencies tell you how the cases are distributed among categories. You can identify the most common category by finding the largest count and the least common category by finding the smallest count.
You can also compare categories directly.
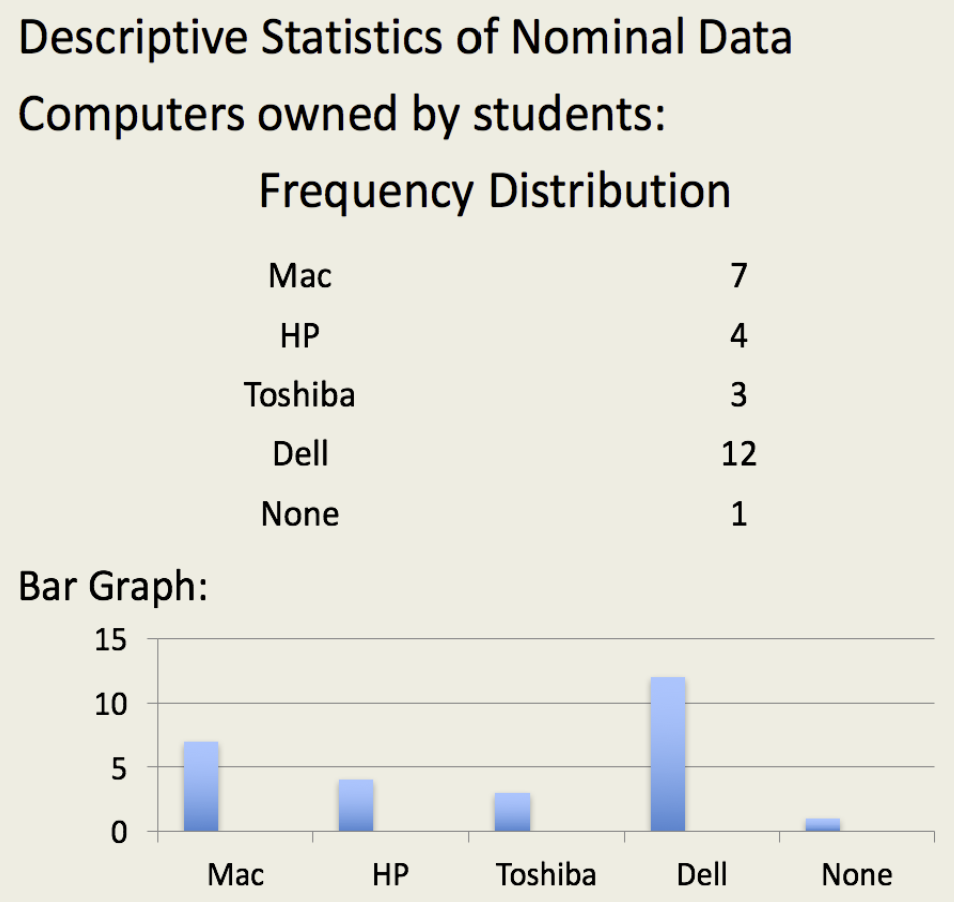
This example bar chart illustrates how categorical (nominal) groups can be compared using bar heights. Because each bar encodes a category’s frequency, differences in heights directly represent differences in counts across categories. Source
If one category has a much larger frequency than another, that tells you the first category occurs more often in the data set. These comparisons should always be stated in context, using the actual category names rather than vague phrases such as “the first one” or “the second one.”
A frequency table can also reveal whether the distribution of cases is balanced or uneven. If the counts are similar across categories, the data are more evenly spread. If one or two categories dominate, the distribution is concentrated in those categories.
The table does not explain why the counts look the way they do. It simply summarizes what was observed in the data.
Common Mistakes to Avoid
Several common errors can reduce the quality of a frequency table.
Using unclear categories: If category labels are vague, readers may not know what each count represents.
Counting inconsistently: Every case must be counted using the same category rules.
Omitting cases: Leaving out responses makes the totals inaccurate.
Double-counting cases: A case counted twice inflates the frequency for a category.
Ignoring the total: The sum of the category counts should match the number of cases collected.
Treating category labels like numerical measurements: Even if categories are coded with numbers, the table still represents groups, not amounts.
A strong frequency table is simple, accurate, and easy to interpret. Its purpose is to show how many cases fall into each category, so clarity and correct counting are the central goals.
Practice Questions
A survey asked 40 students which type of transportation they used to get to school. A frequency table shows the following counts:
Bus: 14 Car: 11 Walk: 9 Bike: ?
Find the missing frequency for Bike and state what that frequency means in context.
1 mark for finding the missing frequency as 6
1 mark for stating that 6 students traveled to school by bike
A teacher collects responses from 60 students about their preferred after-school activity. A student creates a frequency table, but uses both “Sports” and “sports” as separate categories and forgets to include 4 blank responses.
The corrected categories are: Sports: 22 Music: 13 Art: 9 Clubs: 12 No response: 4
(a) Identify two problems with the student’s original frequency table.
(b) Describe a correct process for constructing a valid frequency table from the raw responses.
(c) Use the corrected frequency table to write two statements about the distribution of the data in context.
1 mark for identifying that “Sports” and “sports” should be treated as the same category
1 mark for identifying that the 4 blank responses were omitted and the table was therefore incomplete
2 marks for describing a valid process, such as:
identify the categories clearly
count each response once
combine equivalent labels consistently
include all cases
check that frequencies add to 60
1 mark for two correct contextual statements, such as:
Sports is the most common preferred after-school activity
Art is less common than Music, Sports, and Clubs
4 students gave no response
FAQ
If missing responses are relevant, include them as a separate category such as No response or Missing.
If they are excluded, that decision should be stated clearly so readers know the table does not represent every case collected.
Yes, order can affect readability even though it does not change the counts.
Useful choices include:
alphabetical order
a natural order from the context
an order that matches how data were collected
The main goal is consistency and clarity.
Combining categories can be reasonable when labels mean the same thing or when the original coding is unnecessarily detailed.
However, categories should only be merged according to a clear rule applied to all cases. You should not combine categories in a way that hides important distinctions.
An Other category is often used when a small number of uncommon responses do not fit the main listed categories.
This can make the table easier to read, but it should be used carefully. If too many different responses are grouped into Other, the table may lose useful detail.
Number labels do not automatically make the data quantitative.
If the numbers stand for groups or response options, the variable is still categorical, and the frequency table is still counting cases in categories rather than measuring amounts.
