
AP Syllabus focus: 'The mean, standard deviation, and range are nonresistant because outliers influence them. The median and IQR are resistant because outliers have little effect.'
Choosing the right numerical summary matters because unusual observations can distort some measures much more than others. AP Statistics expects you to recognize which summaries stay stable and which are easily pulled.
Understanding resistance
A summary measure can be described by how strongly it reacts when a data set includes an unusually large or unusually small value. This matters because real data often contain a few observations that are far from the rest.
Resistant measure: A numerical summary that changes little when a small number of unusually large or unusually small observations are added or altered.
Resistance means stability, not complete immunity.
Nonresistant measure: A numerical summary that can change noticeably when a small number of unusually large or unusually small observations are added or altered.
In AP Statistics, the key distinction is that the median and IQR are resistant, while the mean, standard deviation, and range are nonresistant. When you choose a summary, you are deciding whether protection from the influence of outliers is important.
Why some measures are more sensitive
Mean and standard deviation
The mean uses every observation in the data set. Because each value contributes to the total, a single extreme observation can pull the mean upward or downward. The larger that unusual value is, the more influence it can have.
The standard deviation is also nonresistant because it measures spread around the mean. If one observation lies far from the rest, the overall variability increases, and the standard deviation can become much larger.
This means an outlier can affect both the reported center and the reported spread when these measures are used.
Range
The range is especially sensitive because it depends only on the smallest and largest observations. If either endpoint changes, the range changes immediately. One extreme value can therefore make the data appear much more spread out than most observations actually suggest.
Median and IQR
The median depends on position in an ordered list, not on the exact size of the most extreme values. The IQR is based on the middle half of the data, so it usually ignores unusually small or large observations near the ends. As a result, these two measures give a more stable picture of center and spread when outliers are present.
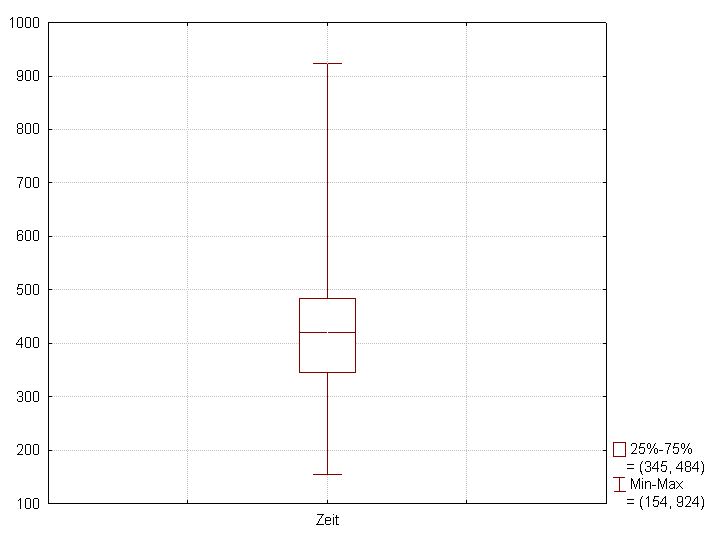
This figure illustrates a standard boxplot, where the median is marked inside the box and the IQR is represented by the box’s width (from to ). Points beyond the whiskers are plotted as outliers, visually emphasizing that median and IQR are determined by position and the middle portion of the data rather than the most extreme values. Source
Choosing appropriate summaries
When a data set contains influential outliers, median and IQR are usually the better choice. They describe the typical value and the variability of the bulk of the data without allowing a few unusual observations to dominate the summary.
When outliers are not strongly affecting the data, mean and standard deviation may still be useful because they incorporate all observations. However, once extreme values become influential, these nonresistant measures can give a misleading impression of both center and spread.
A strong AP Statistics response should not only name a measure but also explain why it is appropriate. The essential reasoning is:
if outliers are influential, choose median and IQR because they are resistant
avoid relying on mean, standard deviation, and range because they are nonresistant
if you report center and spread together, pair measures with similar behavior toward outliers
One common pairing is median with IQR. Another is mean with standard deviation. These pairings are helpful because the measures in each pair respond to unusual values in a consistent way. The range can still describe overall extent, but it is rarely the best main measure of spread when resistance matters.
What resistance means in practice
Resistant measures do not ignore the data set. Instead, they prevent a small number of extreme observations from controlling the summary. This is important when the goal is to describe what is typical for most individuals in the data.
Nonresistant measures are not bad measures. They are simply more sensitive. That sensitivity can be helpful when every observation should strongly affect the summary, but it can also be a weakness when a few extreme values are not representative of the broader pattern.
This is why AP Statistics often expects you to think about the role of outliers before selecting summary statistics. The choice is not automatic; it depends on whether you want a summary that stays stable or one that reacts strongly to extremes.
Common decision rules
Questions to ask before choosing
Before selecting a summary, ask:
Are there observations much larger or smaller than most of the data?
Would one extreme value change the reported center a lot?
Do you want to describe the middle of the data or the full impact of every value?
If the answer to the first two questions is yes, a resistant summary is usually more appropriate. If not, a nonresistant summary may be acceptable.
Common mistakes to avoid
Students often lose points by identifying an outlier but still choosing the mean or standard deviation without justification. Another common error is naming the median as resistant but pairing it with the range, which is not resistant. It is also not enough to say that one measure is better without stating the reason. The reason must be connected to the influence, or lack of influence, of outliers.
When you justify a choice, use language such as "the median is resistant to outliers" or "the standard deviation is nonresistant and can be inflated by extreme values." Clear wording shows that you understand the statistical property, not just the vocabulary.
Comparing resistant and nonresistant perspectives
In some contexts, both types of summaries may be reported, but they emphasize different features of the data. Median and IQR focus on the middle portion of the distribution, while mean, standard deviation, and range are more affected by unusual values. The key AP skill is recognizing which set of measures better represents the data when outliers are present.
Practice Questions
A data set contains several unusually large observations. Which pair of statistics is more appropriate for describing the center and spread: mean and standard deviation, or median and IQR? Briefly justify your answer.
1 mark: Chooses median and IQR.
1 mark: States that median and IQR are resistant, or that outliers have little effect on them.
A company records the number of minutes employees spend commuting to work. Most commute times are between 15 and 40 minutes, but a few employees have commute times above 100 minutes.
(a) Classify each measure as resistant or nonresistant: mean, median, range, IQR, standard deviation. [3 marks]
(b) The company wants to report a typical commute time and a measure of spread for most employees. Which measures should it use? Justify your choice. [2 marks]
(a)
1 mark: Correctly identifies median and IQR as resistant.
1 mark: Correctly identifies mean, range, and standard deviation as nonresistant.
1 mark: All five measures classified correctly.
(b)
1 mark: Chooses median for center and IQR for spread.
1 mark: Justifies that outliers have little effect on these resistant measures, or explains that mean, range, and standard deviation are influenced by outliers.
FAQ
Yes. The median is resistant, but it is not completely fixed.
If a new outlier is added to a small data set, the middle position can shift, so the median may change a little. However, the change is usually much smaller than the change in the mean.
Resistance means limited influence, not zero influence.
Standard deviation reacts to how far observations lie from the mean.
A single extreme value may not move the mean very much if the sample is large, but it can still be very far from the center. That large distance increases the measured spread a lot.
So a data set can have a nearly unchanged mean but a much larger standard deviation.
The two extremes can partly balance each other in the mean, so the mean may not move as much as you expect.
However:
the range will usually increase a lot
the standard deviation will often increase
the median and IQR may remain fairly stable
This is one reason you should not judge resistance by looking only at whether the mean changed.
A trimmed mean removes a small percentage of the lowest and highest values before calculating the mean.
That makes it more resistant than the ordinary mean, because extreme observations have less influence.
However, AP Statistics usually emphasizes the standard summaries:
median and IQR as resistant
mean, standard deviation, and range as nonresistant
So a trimmed mean is useful to know about, but it is not the main AP measure for this topic.
Including both can show whether unusual values may be affecting the center.
If the two numbers are close, outliers may not be having much impact. If they are far apart, that can signal that extreme values are influencing the mean.
Reporting both also helps different audiences:
some prefer a resistant summary
some want a measure that uses all observations
The choice depends on the purpose of the report.
