
AP Syllabus focus: 'A two-way table summarizes two categorical variables using frequency counts or relative frequencies. A joint relative frequency is a cell frequency divided by the table total.'
When the same individuals are classified by two categorical variables, a two-way table organizes the data clearly and shows how often each category combination occurs in the entire dataset.
Understanding Two-Way Tables
A two-way table is used when each observation provides one category for one variable and one category for a second variable.

A labeled contingency (two-way) table showing how two categorical variables form a grid of interior cells. The row and column totals (marginal totals) and the grand total make it clear what “table total” means when you later compute joint relative frequencies. Source
One variable is usually placed in rows and the other in columns, so the display shows how the categories intersect.
Two-way table: A display that organizes data for two categorical variables by placing one variable in rows and the other in columns, using counts or relative frequencies in the cells.
A two-way table is appropriate only when both variables are categorical. Each individual should fit into exactly one row category and exactly one column category. That way, every person or object is counted once and only once.
Key parts of the display
Rows represent the categories of one variable.
Columns represent the categories of the second variable.
Interior cells represent one specific combination of a row category and a column category.
The table total is the total number of individuals represented by all cells together.
These parts matter because AP Statistics questions often ask you to identify what a specific cell means before doing any computation.
Counts and Relative Frequencies
Some two-way tables display frequency counts, which are the actual numbers of observations in each cell.
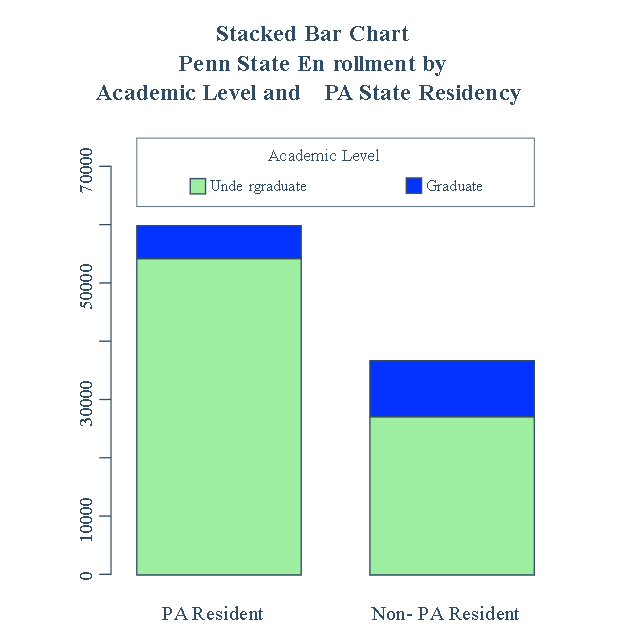
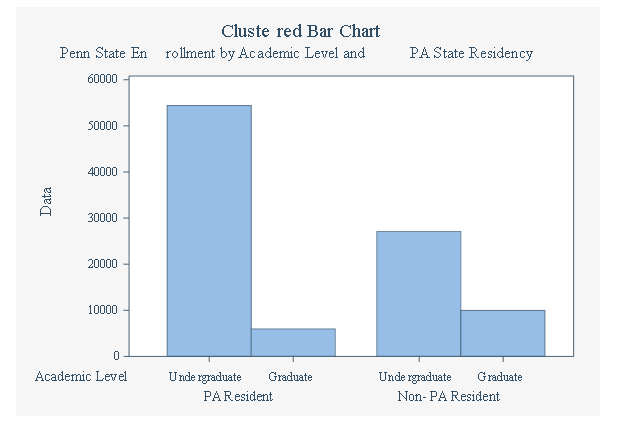
A worked example that presents a two-way table of counts alongside bar-chart displays derived from the same data. Seeing the same cell information represented both in a table and in a segmented (stacked) bar chart reinforces how each interior cell corresponds to one category intersection. Source
Other two-way tables display relative frequencies, which express counts as proportions or percentages. Both formats summarize the same dataset, but they communicate slightly different information.
Counts tell you how many individuals fall into a category combination. Relative frequencies tell you how large that category combination is compared with the full dataset. This is especially helpful when the total number of observations is large or when proportions are easier to interpret than raw counts.
A key relative-frequency idea in this topic is the joint relative frequency.
Joint relative frequency: The proportion of all individuals in the table that fall into one specific cell, found by dividing the cell frequency by the table total.
A joint relative frequency always refers to the entire table, not just one row or one column.
= count in one interior cell of the table
= total count of all individuals in the table
Because the denominator is the overall table total, a joint relative frequency describes how common a specific combination of categories is in the full set of observations.
Reading a Cell Correctly
Every interior cell in a two-way table should be read as the intersection of two categories. A cell does not refer to only the row label or only the column label. Instead, it refers to both at the same time.
For that reason, a correct interpretation should name both variables.
A classroom-style example using a two-way table that is converted from counts to relative frequencies, with interpretation tied to a specific cell. This supports precise “intersection of two categories” reading, even though the example emphasizes row-relative (conditional) frequency rather than joint relative frequency. Source
A strong AP Statistics statement sounds like “the proportion of all surveyed individuals who are in category A and category B,” rather than simply giving a number without context.
What a joint relative frequency answers
What proportion of the entire dataset is in this one cell?
How common is this exact combination of categories among all individuals?
What fraction of the full sample or population meets both conditions?
This is why the word joint matters. The cell combines information from two categorical variables at once.
Building a Two-Way Table from Data
When constructing a two-way table, use a consistent process:
Identify the two categorical variables being recorded.
List the categories of one variable as rows.
List the categories of the other variable as columns.
Place each individual in the single cell matching both of that individual’s categories.
Add all cell counts to obtain the table total.
If joint relative frequencies are needed, divide each cell count by the table total.
Keep the row and column arrangement the same when switching from counts to relative frequencies.
A well-constructed two-way table makes later interpretation much easier because each cell has a precise meaning tied to both variables.
Interpreting Joint Relative Frequency in Context
A joint relative frequency can be written as a decimal or as a percentage, but the interpretation should stay the same. The value should always be described as a proportion of all individuals in the table.
This point is easy to miss. If a problem asks for a joint relative frequency, using a row total or a column total as the denominator changes the meaning of the result. The correct denominator for a joint relative frequency is always the full table total.
Context is also important. Saying “” is incomplete. Saying “ of all students surveyed were juniors who rode the bus to school” is a correct contextual interpretation because it identifies the two categories and the whole group being described.
Common Errors to Avoid
Using two variables that are not categorical.
Treating a cell as if it described only one variable instead of the intersection of two variables.
Dividing by a row total or column total when the question asks for a joint relative frequency.
Forgetting to include the full table total when converting counts to relative frequencies.
Reporting a decimal or percentage without stating what the two categories are.
Making counting errors so the cells do not account for every individual in the dataset.
Practice Questions
A survey of 150 students recorded whether each student brings lunch from home and whether the student has a part-time job. There were 36 students who both bring lunch from home and have a part-time job.
Find the joint relative frequency for students who both bring lunch from home and have a part-time job.
1 mark for using the table total as the denominator:
1 mark for the correct value: or 24%, with clear context
A college surveyed 240 students about residence status and meal plan status. The data are listed below.
96 students live on campus and have a meal plan.
24 students live on campus and do not have a meal plan.
36 students live off campus and have a meal plan.
84 students live off campus and do not have a meal plan.
Answer the following.
(a) State the table total.
(b) Find the joint relative frequency for each of the four category combinations.
(c) Interpret the joint relative frequency for students who live off campus and have a meal plan.
(d) Explain how you can check that your set of joint relative frequencies is reasonable.
(a) 1 mark for table total of 240
(b) 2 marks for correct joint relative frequencies:
on campus and meal plan:
on campus and no meal plan:
off campus and meal plan:
off campus and no meal plan:
Award 1 mark for two or three correct values, 2 marks for all four correct
(c) 1 mark for a correct contextual interpretation such as “15% of all surveyed students live off campus and have a meal plan”
(d) 1 mark for explaining that the four joint relative frequencies should add to
FAQ
You should decide how missing responses will be handled before computing joint relative frequencies.
If only a few responses are missing, analysts often exclude those individuals and base the table on complete cases only.
If missingness is important, a separate category such as “No response” may be added.
Whichever method is used, the table total must match the individuals actually included in the table.
Yes. Switching rows and columns does not change the underlying information.
The same cell combinations are still present, so the frequency counts and joint relative frequencies stay the same. Only the orientation of the display changes.
This can make a table easier to read, especially if one variable has shorter category names or fewer categories.
Yes. In AP Statistics, joint relative frequencies are often computed from sample data.
In that setting, they describe the sample itself. They can also be used as estimates of corresponding population proportions, but they are still subject to sampling variability.
That means a different random sample from the same population might produce slightly different joint relative frequencies.
A standard two-way table assumes each individual belongs to exactly one category for each variable.
If a variable allows multiple responses, you may need to:
redefine the categories so they do not overlap
create separate yes/no variables for each possible response
use a different display designed for multiple-response data
Without that adjustment, one person could be counted more than once, which would distort the table total and the joint relative frequencies.
Use enough precision to communicate the result clearly and consistently.
Common choices are:
two decimal places for proportions, such as $0.27$
one decimal place for percentages, such as 27.0%
Your level of rounding should match the context of the problem, the size of the dataset, and any instructions given. The main goal is consistency across all cells so the table is easy to read and interpret.
