
AP Syllabus focus: 'Intercept'
In linear regression, slope is the main measure of how the predicted response changes as the explanatory variable increases, so interpreting it correctly is essential on AP Statistics questions.
Understanding Slope
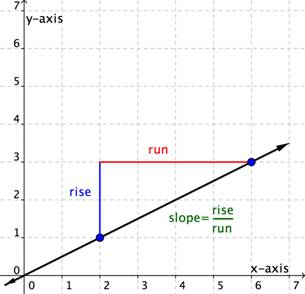
A line on a coordinate grid with the “rise” (vertical change) and “run” (horizontal change) marked to show that slope is a rate: . The labeled right-triangle makes the sign and size of the slope interpretable directly from the graph. Source
It describes the rate of change in the model, so it answers the question, “How much does the predicted response change when increases by 1 unit?”
Slope: In a linear regression model, the slope is the predicted change in the response variable for each one-unit increase in the explanatory variable.
Because slope is tied to a one-unit increase in the explanatory variable, it must always be interpreted with the variables named and with their units. A slope value by itself is incomplete. Saying only that the slope is 2.4 leaves out the most important statistical meaning: 2.4 what, and for a one-unit change in which variable?
Sign of the Slope
The sign of the slope gives the direction of the linear relationship in the model.
If , larger values of the explanatory variable are associated with larger predicted values of the response variable.
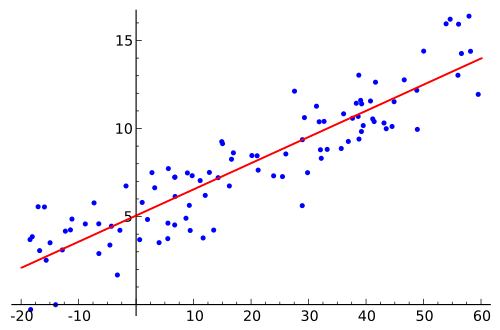
Randomly scattered data points with a least-squares regression line overlaid, illustrating a positive linear association. The upward tilt of the fitted line corresponds to , meaning predicted values of increase as increases. Source
If , larger values of the explanatory variable are associated with smaller predicted values of the response variable.
If , the model predicts no linear change in the response as the explanatory variable increases.
This sign should appear naturally in the interpretation. A negative slope should be described as a decrease, while a positive slope should be described as an increase. Students often lose credit by ignoring the sign or describing it incorrectly.
Slope can also be viewed as the constant rate of change built into the regression model.
= predicted change in the response variable
= slope of the regression line, in response-variable units per explanatory-variable unit
= change in the explanatory variable
Since the model is linear, the same slope applies throughout the line. That means the model predicts the same amount of change in the response for each additional one-unit change in the explanatory variable. This does not mean every observed data point changes by exactly that amount. It means the regression line changes at that rate.
Interpreting Slope Correctly
On AP Statistics questions, slope must be interpreted in context rather than restated as a raw number. A strong interpretation usually includes four parts:
identify the explanatory variable
identify the response variable
describe the change as a predicted change
include the units and the one-unit increase in the explanatory variable
A good interpretation often follows this pattern: for each one-unit increase in the explanatory variable, the predicted value of the response variable changes by the slope amount, on average. The phrase on average is helpful because the regression line summarizes an overall pattern rather than an exact rule for every observation.
Be careful not to reverse the variables. The slope tells how the response variable changes when the explanatory variable changes, not the other way around. The order matters because the slope is attached to the explanatory variable in the model.
What the Slope Does and Does Not Say
Slope tells you about the model’s prediction, not about certainty. If the slope is 5, the model predicts a change of 5 response units for each 1-unit increase in the explanatory variable. It does not guarantee that every individual case will show that exact change.
Slope also does not describe isolated points.
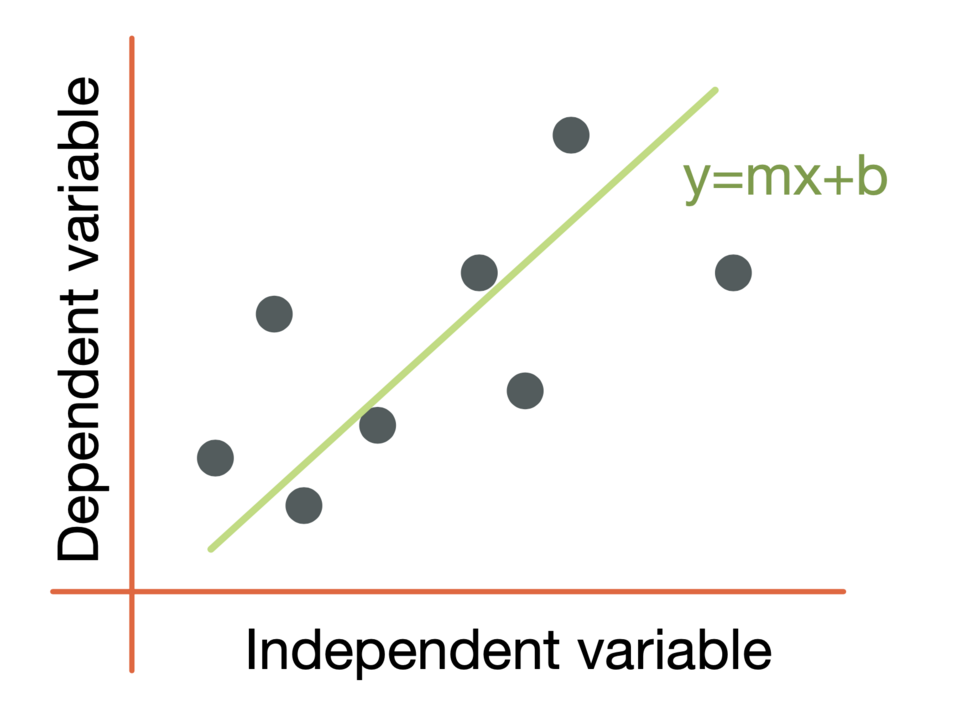
A schematic scatterplot with a fitted regression line, illustrating that the slope describes the overall linear trend of the model rather than the behavior of any single observation. The vertical gaps between points and the line hint at residuals—reinforcing that the line provides predictions, not guarantees. Source
It belongs to the regression line, so it describes the line’s overall rate of change. Individual observations may lie above or below the line, but the slope still gives the predicted change along the line itself.
Units and Magnitude
The slope carries units. Its units are response-variable units per explanatory-variable unit. Because of this, the numerical size of the slope must always be judged in context. A slope of 0.5 may be minor in one setting and substantial in another, depending on the variables and their measurement scales.
The absolute value of the slope, , describes how steeply the regression line rises or falls. Larger absolute values mean a greater predicted change in the response for each one-unit increase in the explanatory variable. Smaller absolute values mean a flatter line and less predicted change per unit.
Common Errors in Slope Interpretation
Students often lose points by making slope interpretations too vague or too strong.
Do not say the response will change by the slope amount. The model gives a prediction, not a guarantee.
Do not forget the phrase for each one-unit increase in the explanatory variable. Slope is always a rate.
Do not leave out units. Without units, the interpretation is incomplete.
Do not interpret a negative slope as if it were positive, or vice versa.
Do not interpret the response as causing the explanatory variable to change.
Do not claim more than the model gives. The slope describes the predicted linear change, not the exact behavior of every observation.
Precise wording matters. On AP Statistics assessments, a slope interpretation is strongest when it is clear, contextual, and directly tied to the explanatory variable, the response variable, the units, and the idea of prediction.
Practice Questions
A least-squares regression line for predicting quiz score from minutes studied is given by .
Interpret the slope in context. [2 marks]
1 mark: States that for each additional 1 minute studied, the predicted quiz score increases by points.
1 mark: Uses correct context and indicates prediction, such as “predicted” or “on average.”
A researcher uses a linear regression model to predict reaction time, in milliseconds, from hours of sleep the previous night. The regression equation is .
(a) State the slope of the regression line. [1 mark]
(b) Interpret the slope in context. [2 marks]
(c) Explain what the negative sign of the slope tells you about the predicted relationship between sleep and reaction time. [1 mark]
(d) A student says, “If a person sleeps 1 more hour, their reaction time will definitely drop by 12.4 milliseconds.” Explain one problem with this statement. [1 mark]
(a) 1 mark: Slope is .
(b) 1 mark: States that for each additional hour of sleep, predicted reaction time decreases by milliseconds.
(b) 1 mark: Includes context and prediction language such as “predicted” or “on average.”
(c) 1 mark: Explains that more sleep is associated with lower predicted reaction time.
(d) 1 mark: Explains that the slope gives a prediction from the model, not a definite change for every individual person.
FAQ
Both symbols refer to the slope coefficient in a regression equation.
$b$ is a simple shorthand often used in AP Statistics.
$b_1$ is common in textbooks and software because it leaves room for other coefficients, especially in more advanced models.
For simple linear regression, they mean the same thing: the predicted change in the response for a one-unit increase in the explanatory variable.
The slope changes because the regression model changes.
If you switch the variables, you are now predicting a different quantity, with different units and different vertical residuals. The new slope is generally not the reciprocal of the original slope.
This is why it is so important to know which variable is explanatory and which is response before interpreting slope.
Changing units changes the numerical value of the slope because slope includes units.
For example:
if the response unit becomes larger, the slope number may get smaller
if the explanatory unit becomes larger, the slope number may get larger
The meaning stays consistent, but the number changes to match the new scale. Always interpret slope using the current units shown in the problem.
Yes. A small slope is not automatically unimportant.
Its practical importance depends on things like:
the units being used
the typical range of the explanatory variable
the real-world setting
A slope that looks tiny for a 1-unit increase may represent a meaningful change over a much larger increase in the explanatory variable. Statistical interpretation should stay tied to context, not just the size of the coefficient.
Yes. In practice, the slope cannot be computed if the explanatory variable has no variation.
If every observed $x$ value is the same, there is no way to describe how the predicted response changes as $x$ increases, because $x$ never actually changes in the data.
A regression line needs variation in the explanatory variable for slope to have meaning. Without that variation, the idea of rate of change breaks down.
