
AP Syllabus focus:
‘Discussion on the y-intercept of the least-squares regression line, including cases where the y-intercept does not have a logical interpretation within the context of the data. It will explain the y-intercept's significance in predictions, particularly its role when the explanatory variable is zero.’
This section introduces how the y-intercept functions within a least-squares regression model, focusing on interpretation, contextual meaning, and situations where it becomes misleading or inappropriate.
Understanding the Y-Intercept in Least-Squares Regression
The y-intercept occupies a central role in the structure of a simple linear regression model, which is expressed through the prediction equation . In this context, the y-intercept, denoted by a, represents the predicted value of the response variable when the explanatory variable equals zero. Because of this, interpreting the y-intercept requires both mathematical understanding and careful consideration of context.
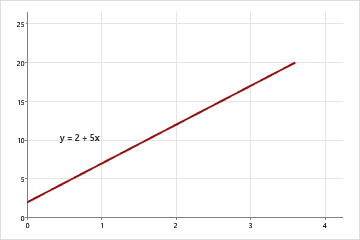
This graph illustrates a regression line with a positive slope and a y-intercept at 2, demonstrating how the intercept represents the predicted value when the explanatory variable is zero. The labeled slope shows how predictions rise with increasing x-values. The explicit slope label provides additional context beyond the subsubtopic’s focus on the y-intercept. Source.
Y-Intercept: The predicted value of the response variable () when the explanatory variable () is zero.
In many real-world scenarios, the value of zero for the explanatory variable either makes sense or is theoretically meaningful. In other situations, however, zero lies far outside the observed data range or represents a condition that is impossible or illogical. As a result, the y-intercept must always be interpreted with careful reference to context to ensure that predictions or explanations are reasonable.
The Role of the Y-Intercept in the Regression Equation
The regression equation uses the y-intercept as a starting point for prediction, anchoring the line vertically on the coordinate plane. The slope then dictates how predictions change as the explanatory variable increases by one unit. When statisticians construct a least-squares regression line, the resulting y-intercept ensures that the line passes through the point representing the means of both variables, . This anchoring gives the model a specific balance that minimizes the squared residuals across all observations.
A regression model therefore integrates the y-intercept not merely as a mathematical artifact but as a component contributing to the model’s overall fit and predictive accuracy.
Interpreting the Y-Intercept in Context
Interpreting the y-intercept always requires asking whether a zero value for the explanatory variable is meaningful. When zero is realistic and lies within or near the range of the observed data, the y-intercept can provide valuable insight into baseline levels or starting values. In such cases, predictions at align naturally with the structure of the regression model and support sensible conclusions about the relationship between variables.
However, when zero is far outside the observed data range, or when it represents a situation that does not or cannot occur, the applicability of the y-intercept becomes limited. The specification emphasizes that the y-intercept may “not have a logical interpretation within the context of the data,” meaning that predictions made at this value could be misleading or scientifically meaningless.

This scatterplot shows a regression line whose y-intercept is slightly below zero, illustrating a context where the predicted value at x = 0 has no logical meaning. The negative intercept contrasts with a response variable that cannot realistically take negative values. This reinforces the importance of evaluating whether zero is a meaningful or feasible value for the explanatory variable before interpreting the y-intercept. Source.
Why the Y-Intercept Sometimes Lacks Logical Interpretation
There are several reasons why the y-intercept may not be meaningful in a regression setting:
Zero is outside the domain of the explanatory variable.
When data only occur at positive values, predictions at zero reflect extrapolation beyond observed conditions.Zero represents an impossible or undefined state.
Some measurements—such as age of college students or height of trees—cannot logically be zero, rendering the y-intercept irrelevant.The relationship itself is not linear near zero.
Even when zero is technically possible, the trend may differ outside the observed data range.
When these conditions arise, the y-intercept still exists mathematically but should not be interpreted as a meaningful real-world prediction.
Using the Y-Intercept for Prediction
Although the y-intercept may not always be interpretable, it still affects predictions across the regression line. Its position determines the vertical placement of the line, ensuring that predictions at all relevant values of the explanatory variable align closely with observed patterns. Students should understand that a regression model remains valid even when the y-intercept itself cannot be given contextual meaning.
The y-intercept is therefore significant not because of its inherent interpretability but because of its role in shaping the model used to generate predictions across the data’s meaningful range.
Key Considerations for AP Statistics Students
When deciding how to interpret the y-intercept in a regression setting, students should rely on a structured evaluation process:
Assess whether zero is a meaningful value for the explanatory variable.
Determine whether zero falls within or near the observed data range, since large extrapolations weaken the prediction’s reliability.
Evaluate the context to identify whether predictions at zero correspond to feasible or realistic conditions.
Avoid assigning meaning when the value does not logically apply to the situation or contradicts common sense.
Focus on the y-intercept’s role in forming the regression line, even when its real-world interpretation is absent.
The y-intercept thus illustrates a broader principle in statistics: mathematical quantities do not always translate directly into meaningful contextual interpretations. Understanding when and why this occurs is an essential analytical skill for interpreting least-squares regression models in applied settings.
FAQ
The y-intercept is a mathematical requirement because a straight line must have both a slope and an intercept to be fully defined.
In least-squares regression, the intercept ensures the line passes through the point representing the means of both variables. This minimises the sum of squared residuals and gives the best possible overall fit, regardless of whether the intercept is interpretable in context.
Yes, but only in models specifically designed to force the line through the origin. These are known as regression-through-the-origin models.
However, such models are rarely used in AP Statistics because forcing the intercept to zero can distort the relationship, increase residuals, and decrease the accuracy of predictions. They should only be used if theory strongly supports a true intercept of zero.
An extreme intercept often indicates that zero is far outside the observed range of the explanatory variable.
It may also suggest that the relationship between variables is not well modelled by a straight line, particularly near the lower end of the scale.
• Extreme values should prompt students to examine plots for curvature.
• It may be a sign that a different model or transformation is more suitable.
High variability in the data increases uncertainty in both slope and intercept estimates. The y-intercept becomes particularly unstable when most x-values are far from zero.
In such cases:
• Small changes in the slope can produce large shifts in the intercept.
• The intercept may differ greatly between samples, reducing confidence in any real-world interpretation.
Reporting the intercept ensures transparency and reproducibility, allowing others to verify calculations and replicate the model.
Additionally, the intercept helps:
• Reconstruct the full regression equation
• Compare models fitted to similar data
• Conduct further statistical analyses that require complete parameter estimates
Practice Questions
Question 1 (1–3 marks)
A researcher fits a least-squares regression line to predict the concentration of a chemical (y) from the temperature of a solution (x). The resulting regression equation has a y-intercept of -4.2.
Explain whether the y-intercept is likely to have a meaningful interpretation in this context.
Question 1 (1–3 marks)
• 1 mark for stating what the y-intercept represents (predicted chemical concentration when temperature is zero).
• 1 mark for recognising that zero degrees may be outside the range of observed temperatures or unrealistic for the chemical process.
• 1 mark for concluding that the y-intercept is unlikely to have a meaningful interpretation if zero temperature is impossible or irrelevant.
Question 2 (4–6 marks)
A study investigates the relationship between the number of hours students revise per week (x) and their predicted exam score (y). A least-squares regression model is fitted, giving the equation:
predicted exam score = 32 + 5.6x.
(a) Interpret the y-intercept in the context of the study.
(b) Discuss whether this interpretation is meaningful.
(c) State one reason why the y-intercept might still be useful even if it lacks a logical real-world interpretation.
Question 2 (4–6 marks)
(a)
• 1 mark for correctly identifying that the y-intercept (32) represents the predicted exam score for a student who revises 0 hours per week.
(b)
• 1 mark for recognising the interpretation may not be meaningful if 0 hours of revision is unrealistic or outside the observed data range.
• 1 mark for explaining that the model may not accurately represent performance at very low revision levels, making the intercept potentially misleading.
(c)
• 1 mark for identifying that the y-intercept helps position the regression line and contributes to predictions within the observed range.
• 1 mark for noting that the y-intercept is mathematically necessary to define the line even if its real-world meaning is limited.
