
AP Syllabus focus:
‘A thorough explanation of the coefficient of determination, r², and its significance. This section will discuss how r², the square of the correlation coefficient r, represents the proportion of the variance in the response variable that is predictable from the explanatory variable. It will illustrate the importance of r² in assessing the model's explanatory power.’
The coefficient of determination (r²) is a key measure in linear regression that indicates how effectively an explanatory variable accounts for variation in a response variable.
The Role of r² in Least-Squares Regression
The coefficient of determination, written as r², plays a central role in interpreting a least-squares regression model because it assesses how well the model explains variability in the response variable. As the AP syllabus emphasizes, r² quantifies the proportion of variance in the response variable that is predictable from the explanatory variable, offering a clear measure of the model’s explanatory strength. Unlike general observations from scatterplots, r² gives a precise numerical value describing how closely the data follow the fitted regression line.
When working with bivariate quantitative data, understanding r² helps determine whether the linear model is useful, somewhat helpful, or largely uninformative. Because r² is computed as the square of the correlation coefficient (r), the value always falls between 0 and 1, making it easy to interpret in terms of proportions or percentages.
Understanding What r² Measures
At its core, r² describes how much of the total variation in the response variable is accounted for by differences in the explanatory variable. Variation in statistics refers to how spread out the values of a variable are around their mean. A strong linear relationship corresponds to less unexplained variation once the regression model is applied.
Coefficient of Determination (r²): The proportion of the variation in the response variable that is explained by the linear relationship with the explanatory variable.
Because r² is expressed as a proportion, meanings are straightforward. For example, an r² of 0.72 indicates that 72% of the variability in the response variable can be predicted from the linear relationship with the explanatory variable. The remaining 28% is unexplained by the model, attributable to other influences or random variability.
Calculating the Coefficient of Determination
Although technology performs the calculation automatically in nearly all AP Statistics settings, knowing the formula deepens conceptual understanding. Since r² is built from the correlation coefficient, students first recognize that r captures the direction and strength of a linear association, and then squaring r gives the proportion of explained variation.
EQUATION
= Correlation coefficient measuring direction and strength of linear association
A single sentence is required here to maintain proper spacing before another definition or equation.
Because r² compares the variation left in the residuals to the total variation in y, it can be interpreted as the fraction of total variation in the response that is explained by the linear model.

This figure illustrates the coefficient of determination for a linear regression, showing how explained and unexplained variation relate to r2r^2r2. The red squares represent residual variation, while the blue squares represent explained variation. The diagram emphasizes that r2r^2r2 can be viewed as one minus the ratio of residual variation to total variation. Source.
Interpreting r² in Context
Interpreting r² always requires contextual reasoning, not just reporting a number. The AP specification emphasizes explaining the significance of r², which means articulating what proportion of variation is explained and what proportion remains unexplained. A strong r² value suggests that the explanatory variable provides meaningful predictive information about the response variable within the scope of the data.
Key Interpretation Points
Higher r² values (close to 1) mean the model explains a large portion of the response variability, indicating a strong linear fit.
Lower r² values (close to 0) suggest that the regression line provides little predictive insight, even if a pattern appears present.
Moderate r² values require careful contextual interpretation, as real-world data often contain noise or complex relationships not captured by a simple linear model.
Because r² depends on the linear form of the relationship, it should never be interpreted without referencing the scatterplot and the underlying form of the data.
In terms of sums of squares, r² = SSreg / SStot = 1 − SSres / SStot, where SSreg is the explained variation and SSres is the unexplained (residual) variation around the regression line.
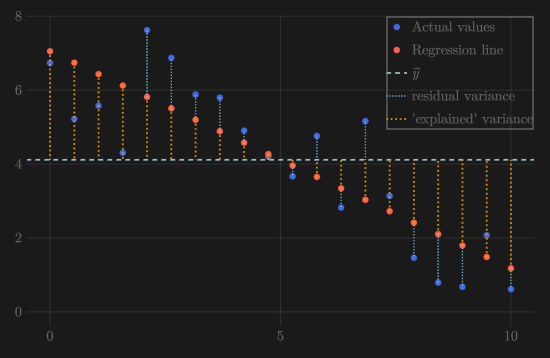
This plot displays observed data points with a regression line and annotations indicating explained and residual sums of squares. It illustrates how total variation is partitioned into components captured and not captured by the model. The relationship between these components forms the basis of the coefficient of determination. Source.
Using r² to Evaluate Model Quality
The coefficient of determination helps judge whether a linear model is appropriate, useful, or insufficient. While a high r² often signals that the linear model fits well, students must remember that a high r² does not guarantee causation, nor does it confirm that the model is the best choice among possible modeling strategies.
r² as a Tool for Assessing Explanatory Power
Consider r² as a measure of how much better the model predicts responses compared to simply using the mean of the response variable. By quantifying improvement over the mean-only prediction, r² offers a clear way to describe the model’s value.
Common Uses of r² in AP Statistics
Comparing multiple linear models to determine which explains more variation
Evaluating whether the linear association is strong enough to justify predictions
Assessing the overall effectiveness of a least-squares regression line
What r² Cannot Tell Us
Although r² is powerful, its limitations must be acknowledged to avoid misinterpretation. A high r² does not:
Indicate that the relationship is causal
Guarantee that the relationship is appropriate for extrapolation
Confirm that the association is linear without examining residuals
Visually, a larger r² corresponds to data points that cluster more tightly around the regression line, leaving little vertical scatter, whereas a smaller r² leaves the points more widely dispersed around the line.
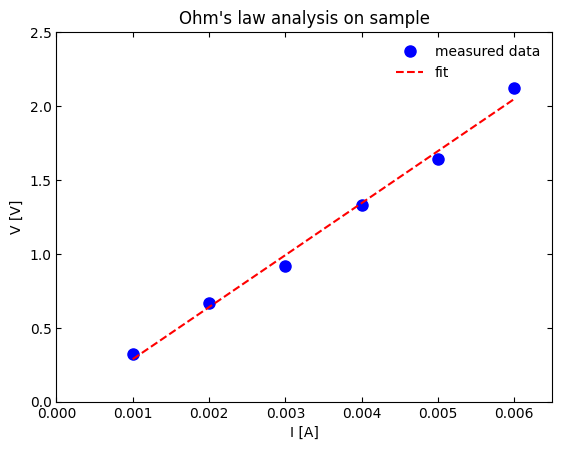
This scatterplot shows experimental data with a fitted regression line illustrating a strong linear relationship. The close alignment of the points with the line reflects a high r2r^2r2 value. The physical context shown (current and voltage) is extra detail not required in AP Statistics, but the visual fit clearly demonstrates the concept. Source.
FAQ
Outliers can substantially distort r squared because they can pull the regression line towards themselves, increasing or decreasing the proportion of explained variance.
If an outlier lies far from the regression line vertically, it typically reduces r squared by increasing unexplained variation.
If an outlier lies far in the horizontal direction, it may artificially inflate r squared, producing a misleading impression of model quality.
Removing or investigating outliers is therefore essential before interpreting r squared.
r squared measures only the proportion of variance explained, not the visual structure or distribution of the points.
Two data sets with identical r squared may differ because of:
• Uneven clustering
• Differences in spread at different x-values
• Distinct patterns such as curvature or grouping
These structural features do not change the proportion of explained variance but can drastically change the appropriateness of a linear model.
No. r squared is tied to the specific response variable because it depends on the total variation of that variable.
If two models predict different response variables, their r squared values cannot be compared meaningfully as each response variable has its own scale, variability, and measurement units.
Comparisons should only be made when the response variable is the same across models.
For simple linear regression taught in AP Statistics, r squared comes from a model with one explanatory variable.
In multiple regression, r squared cannot decrease when adding variables; it stays the same or increases.
However, this increase may be misleading if the added variable does not meaningfully improve prediction.
This is why adjusted r squared is used in advanced statistics, although it is not required in AP Statistics.
r squared evaluates how well a linear model explains variation. If the true relationship is non-linear, r squared may be low even when a strong curved pattern exists.
A low r squared does not mean the variables are unrelated; it simply means a linear model is inappropriate.
Residual plots or transformations are needed to diagnose non-linearity because r squared alone cannot reveal the underlying structure.
Practice Questions
Question 1 (1–3 marks)
A linear regression model is created to predict the yield of a crop (in kilograms) from the amount of fertiliser used (in kilograms). The resulting model has a coefficient of determination of r squared = 0.68.
(a) Interpret the value of r squared in the context of this situation.
(b) State what the remaining proportion of variation represents.
Question 1
(a) (1–2 marks)
• 1 mark for stating that 68% of the variation in crop yield is explained by the linear relationship with fertiliser amount.
• An additional mark if the explanation is clearly contextualised (mentions yield and fertiliser explicitly).
(b) (1 mark)
• States that the remaining 32% of variation is unexplained by the model or due to other factors or natural variability.
Question 2 (4–6 marks)
A researcher investigates the relationship between students’ study time (in hours per week) and their test scores. A linear regression model is fitted, and the coefficient of determination is found to be r squared = 0.52.
(a) Explain what the value r squared = 0.52 indicates about the relationship between study time and test scores.
(b) The correlation coefficient for the model is positive. Explain how this relates to the coefficient of determination.
(c) Discuss one reason why a moderately high r squared value does not necessarily imply that more study time causes higher test scores.
(d) Describe how a residual plot could be used to judge whether the linear model is appropriate for this data set.
Question 2
(a) (1–2 marks)
• 1 mark for stating that 52% of the variation in test scores is explained by differences in study time.
• 1 mark for clear contextualisation.
(b) (1 mark)
• States that r squared is the square of the correlation coefficient, so a positive correlation produces a positive r whose square gives 0.52.
(c) (1–2 marks)
Award up to 2 marks for any valid explanation, such as:
• Correlation does not imply causation.
• Confounding variables may be affecting test scores.
• The relationship may not be strictly linear despite the r squared value.
(d) (1–2 marks)
• 1 mark for stating that the residual plot should show no clear pattern if the linear model is appropriate.
• 1 mark for explaining that patterns such as curves, funnels, or clustering indicate that a linear model may be unsuitable.
