
AP Syllabus focus:
‘Instructions on how to interpret the coefficients of the least-squares regression model, including the estimated slope and y-intercept. It will elaborate on how the slope indicates the change in the predicted y-value for a one-unit increase in x, and how the y-intercept provides the predicted y-value when x is zero.’
Interpreting regression coefficients helps explain how an explanatory variable is associated with a response variable in a least-squares regression model, strengthening understanding of bivariate relationships.
Interpreting the Regression Coefficients
The coefficients of a least-squares regression line describe how predicted values of the response variable change in relation to the explanatory variable. Understanding these coefficients is essential because they provide meaning to the fitted model and reveal the nature of the relationship being studied.
The Structure of the Least-Squares Regression Line
A simple linear regression model uses an equation to predict a response value based on an explanatory variable. This structure allows researchers to interpret patterns, tendencies, and expected outcomes.
EQUATION
= Predicted value of the response variable
= Estimated y-intercept of the regression line
= Estimated slope of the regression line
= Value of the explanatory variable
The slope and y-intercept each play a unique interpretive role, offering complementary insights into the modeled association.
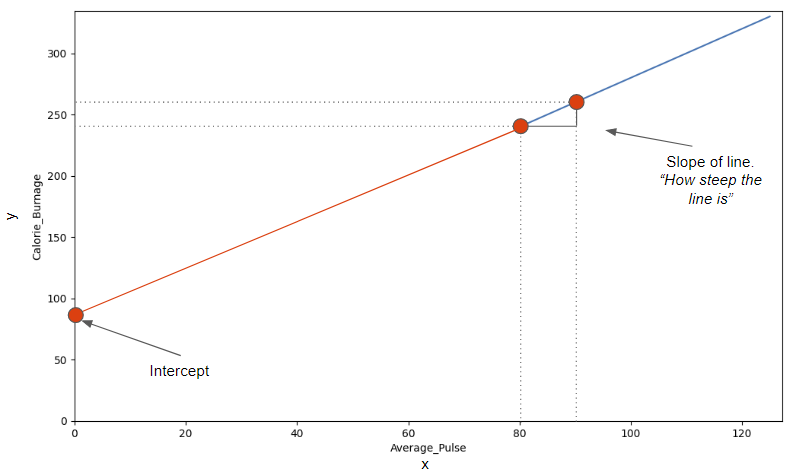
This diagram shows a straight line with its slope and y-intercept labeled. The slope measures how predicted values change as the explanatory variable increases, while the intercept is the predicted value when x = 0. The calorie-burn context included in the figure is not required by the syllabus but helps illustrate these concepts. Source.
Understanding the Slope
The slope is the coefficient that quantifies how much the predicted response variable changes for every one-unit increase in the explanatory variable. This makes the slope central to describing the direction and strength of the linear association.
Slope: The amount by which the predicted response variable changes when the explanatory variable increases by exactly one unit.
The slope’s sign indicates direction. A positive slope suggests that larger values of the explanatory variable are associated with larger predicted response values, while a negative slope indicates an inverse association. Because slope reflects the estimated rate of change, it ties directly to the meaning of the variables in context, aligning with the specification’s emphasis on understanding how a one-unit increase in x affects predicted y.
In interpreting slope, it is important to express the units clearly. Doing so maintains precision and ensures that the real-world meaning of the model is preserved. Since AP Statistics emphasizes conceptual clarity, students must connect the numerical value of the slope to the real variables being studied.
Understanding the Y-Intercept
The y-intercept describes the predicted value of the response variable when the explanatory variable equals zero. Although mathematically necessary, the y-intercept may or may not have a meaningful interpretation depending on the context.
Y-intercept: The predicted response value when the explanatory variable is equal to zero.
The specification highlights that the y-intercept provides “the predicted y-value when x is zero,” underscoring its conceptual role. In cases where a value of zero for the explanatory variable falls outside the observable range or lacks practical meaning, the y-intercept should still be identified but may not be interpreted. Understanding this distinction is a vital component of regression literacy.
When zero is a realistic input value, the y-intercept conveys an important baseline prediction. When zero is unrealistic, students must recognize that the intercept is simply part of the algebraic structure of the regression line, not a meaningful real-world estimate.
How the Coefficients Work Together
Interpreting coefficients effectively requires seeing how they interact to describe a complete linear model. The regression line uses the slope to show how predictions shift with changes in the explanatory variable, while the y-intercept anchors the line to a specific predicted value at a defined point. Together, these coefficients express the entire predictive mechanism.
Key relationships to emphasize include:
Slope determines the rate of predicted change, establishing the model’s directional behavior.
Y-intercept establishes a starting prediction, used only when meaningful in context.
Both coefficients contribute to the model’s interpretability, aligning with the specification’s requirement to explain the meaning of each within the least-squares regression model.
Interpreting Coefficients Within Context
Regression coefficients must always be interpreted using the real variables from the study. Without context, interpretations lose meaning and may mislead. Students should follow a structured approach to ensure clarity and alignment with AP expectations.
Recommended components of a contextual interpretation:
Identify the units of both variables.
State the direction of the association (positive or negative).
Use the appropriate coefficient (slope or intercept) to explain predicted behavior.
Clarify whether the y-intercept is meaningful, based on the validity of zero as an input.
By connecting the mathematical model to the real-world situation, students achieve accurate and meaningful interpretations that reflect a deeper understanding of the relationship between variables.
Essential Skills for AP-Level Interpretation
To meet AP standards, students should be able to:
Explain clearly how the slope represents the predicted change in the response variable for a one-unit increase in the explanatory variable.
Determine whether the y-intercept has a logical interpretation in context.
Translate regression coefficients into meaningful verbal statements without assuming causation.
Recognize that coefficients describe predicted values, not guarantees or causal effects.
These competencies align directly with the syllabus requirement to interpret coefficients in the least-squares regression model with precision and contextual awareness.
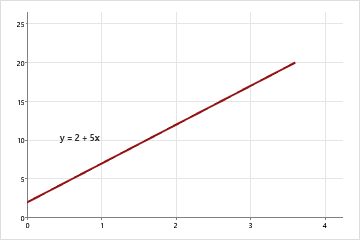
These three graphs illustrate lines with positive, negative, and zero slopes, each with a labeled y-intercept. Together they highlight how the sign and magnitude of the slope shape predicted changes in the response variable, while the intercept anchors the predicted value when x = 0. The numerical examples originate from Minitab but accurately demonstrate the geometric meaning of regression coefficients. Source.
FAQ
A slope may be statistically significant but still too small to matter in practical terms. Practical importance depends on the units and real-world impact of the predicted change.
Consider:
• Whether the size of the predicted change per unit increase in the explanatory variable is meaningful.
• How the magnitude compares with natural variability or measurement error.
• Whether the predicted changes would lead to noticeable or actionable differences in context.
Even if the x-value of zero lies inside the numerical range, the intercept might still be illogical if zero does not make sense for the variable measured.
For example, zero may represent a condition that cannot physically occur or is inconsistent with the study design.
In such cases, the intercept remains mathematically required but should not be interpreted as a real prediction.
Yes. A negative or positive slope always reflects the linear pattern in the sample, but may not capture the full underlying relationship.
Possible reasons include:
• Important non-linear patterns hidden by a linear model.
• Influential points reversing or exaggerating the overall trend.
• A weak linear association where the sign is sensitive to small data changes.
Differences arise from how the samples were collected or how variables were measured.
Common causes include:
• Using different subsets of data or sample sizes.
• Measurement error or inconsistent units.
• Removal or inclusion of outliers or high-leverage points.
• A change in the range of the explanatory variable, which can strongly influence slope estimates.
Ensure that the output corresponds to the variables and units intended for interpretation.
Before interpreting, verify:
• The correct variable is treated as the explanatory variable.
• Units and scaling (e.g., thousands, percentages) match the context.
• No unintended transformations were applied by the software.
• The fitted model is appropriate for describing a linear trend in the data.
Practice Questions
Question 1 (1–3 marks)
A researcher fits a least-squares regression line to predict the concentration of a chemical (in mg/L) from the temperature of the solution (in °C). The regression equation is:
predicted concentration = 12.4 − 0.18(temperature).
(a) Interpret the slope of the regression line in context.
(b) Interpret the y-intercept in context, commenting on whether it is meaningful.
Question 1
(a) 1 mark
• Correct interpretation of the slope: for each 1°C increase in temperature, the predicted concentration decreases by 0.18 mg/L. (1)
(b) 1–2 marks
• States that the intercept represents the predicted concentration when temperature is 0°C. (1)
• Comments appropriately on whether this is meaningful (e.g., 0°C may or may not be relevant to the experiment; interpretation may be unrealistic or outside the range of data). (1)
Question 2 (4–6 marks)
A sports scientist records the number of hours athletes spend training per week (x) and their predicted race performance score (y). A least-squares regression model is produced, giving the following equation:
predicted score = 42.7 + 3.9(hours of training).
(a) State the meaning of the slope within this context.
(b) Explain clearly what the intercept represents and whether it is reasonable to interpret it.
(c) The scientist claims: “Because the slope is positive, increasing training causes better performance.”
Discuss the validity of this claim with reference to the regression coefficients.
Question 2
(a) 1–2 marks
• States that for each additional hour of training per week, the predicted performance score increases by 3.9 points. (1)
• Interpretation must be given in context (training and performance). (1)
(b) 1–2 marks
• Identifies the intercept as the predicted performance score for an athlete who trains 0 hours per week. (1)
• States whether this value is reasonable to interpret (e.g., may not be meaningful if 0 hours is outside observed range or unrealistic for athletes). (1)
(c) 2–3 marks
• States that a positive slope indicates an association, not causation. (1)
• Explains that regression coefficients alone do not establish cause-and-effect relationships. (1)
• Notes that other variables or confounding factors may explain the association. (1)
