
AP Syllabus focus: 'A high-leverage point has an unusual x-value. An influential point substantially changes the regression relationship when it is removed.'
In regression, a single observation can have far more impact than the rest of the data. Recognizing that possibility is essential before trusting a fitted linear relationship.
What makes these points important
Regression uses all observations to describe a relationship between an explanatory variable and a response variable. Most points contribute modestly, but some can pull the fitted line much more than others. When that happens, the line, its slope, and the predictions from it may depend heavily on a very small part of the data. Identifying these observations helps prevent misleading interpretations.
High-leverage points
High-leverage point: An observation with an unusual value of the explanatory variable, so it lies far from the center of the x-values.
A point can stand out because of where it falls along the explanatory axis, not because of how high or low it appears. Observations near the middle of the x-values usually have limited ability to pull the line horizontally. Observations far from the rest of the x-values can have much more opportunity to affect the fitted relationship.
A high-leverage point is identified by its unusual x-value.
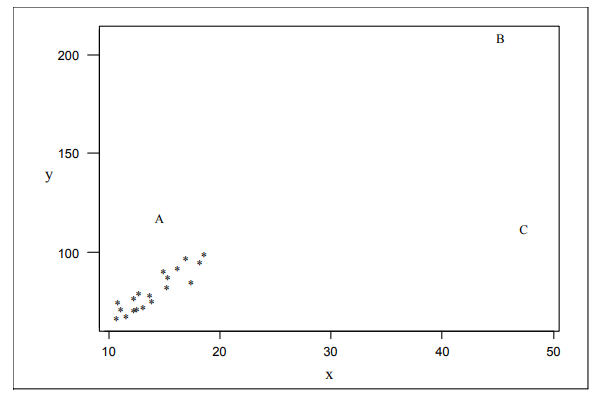
Scatterplot illustrating three different “unusual point” roles in regression: a low-leverage outlier (A), a high-leverage point that still fits the overall trend (B), and a high-leverage point that can distort the fit (C). The labeled points emphasize that leverage is about extreme x-position, while influence depends on whether the point pulls the fitted relationship away from the main pattern. Source
In a scatterplot, it often appears isolated to the far left or far right. Because regression lines try to reflect the overall pattern, a point at an extreme x-location can have considerable pulling power.
Influential points
Influential point: An observation whose removal substantially changes the fitted regression relationship.
Not every unusual x-value actually changes the regression relationship very much. Influence is about impact, not just appearance. To decide whether a point is influential, think about fitting the regression model twice: once with the point and once without it. If the line changes substantially, the point is influential.
An influential point matters because it changes what the model says about the relationship in the data. That change might appear in the slope, the intercept, the direction of the line, or the predictions made from the model.
How to recognize them in a scatterplot
Start with horizontal position
The main visual clue for high leverage is distance in the x-direction from the bulk of the data. A point may have an ordinary response value but still deserve attention if its x-value is extreme. For this topic, the key feature is unusual position along the explanatory variable.
Then ask about effect on the fitted line
A point becomes influential only if it changes the regression relationship substantially. Useful questions include:
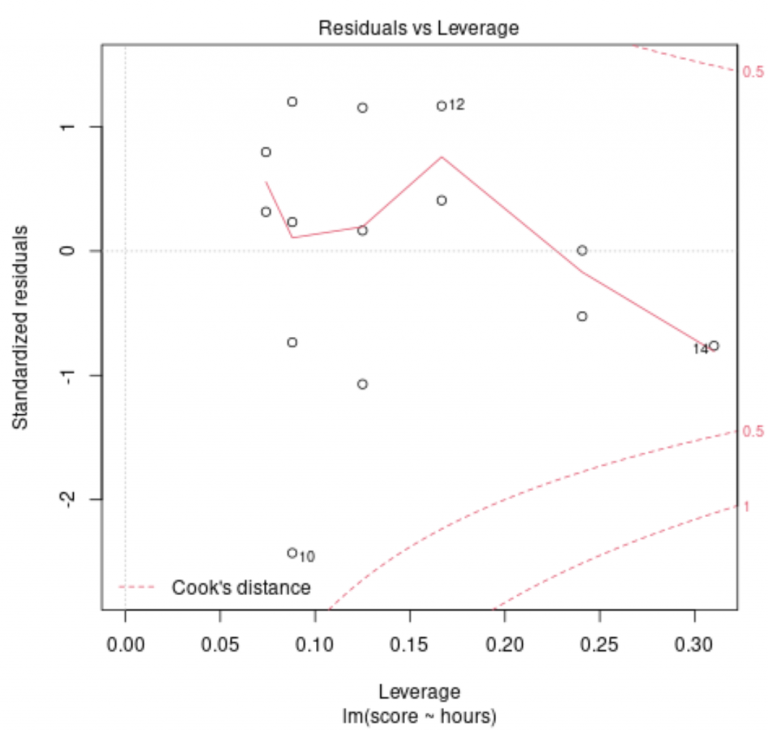
Residuals-versus-leverage plot with Cook’s distance reference curves shows how leverage and residual size combine to create influence. Points far to the right have higher leverage, but they are most concerning when they also have large residuals—pushing them beyond Cook’s distance contours and signaling potential influence on the fitted regression. Source
Does the line rotate noticeably when the point is included?
Does the slope become much steeper, much flatter, or even change sign?
Do predicted values change a lot after the point is removed?
Does the overall story told by the line look different without that observation?
A visual comparison of the fitted line with and without the point is often the clearest way to judge influence.
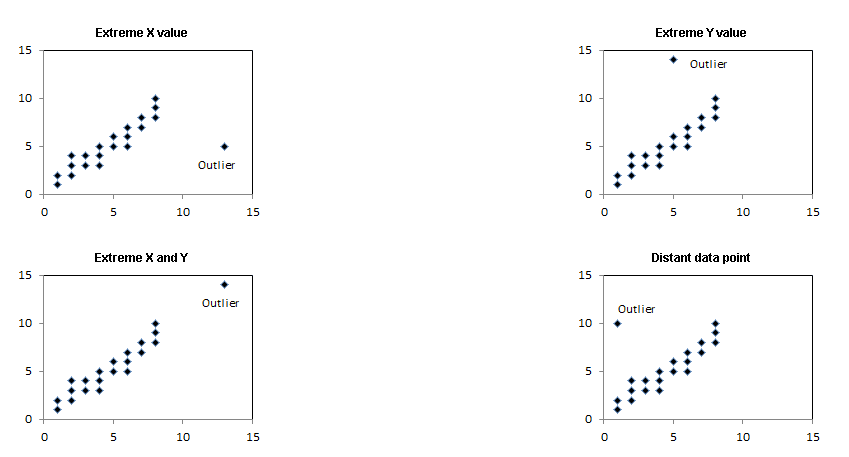
Paired scatterplots compare a regression fit with an outlier removed versus included. The side-by-side setup makes influence visible: adding one unusual observation can noticeably rotate the least-squares line and change summary results (such as the reported regression equation and ), even though the rest of the data stay the same. Source
High leverage does not guarantee influence
This distinction is one of the most important ideas in this subsubtopic. A point can be far from the rest of the x-values and still match the same general trend as the other observations. In that case, it may support the existing pattern rather than distort it. Such a point has high leverage but may have little influence.
By contrast, a point with an extreme x-value that does not align with the rest of the relationship can pull the line toward itself. Because it is so far from the center of the explanatory values, even one observation can shift the fitted relationship substantially. That is when high leverage often leads to influence.
Why influential points matter for interpretation
Effects on regression results
An influential point can change:
the estimated slope, altering the apparent rate of change
the intercept, shifting the line upward or downward
predicted values, sometimes by a large amount
the description of how strongly the variables appear to be related
Because of this, a reported regression line may describe the data very differently depending on whether one unusual observation is present.
Effects on statistical communication
In practice, influential points matter because they can affect conclusions. A researcher, business analyst, or policymaker may make different decisions if a fitted line is being driven by one extreme case. For AP Statistics, the key habit is to avoid accepting a regression result automatically when a scatterplot suggests an unusual x-value.
What to do when one appears
Finding a high-leverage or influential point does not mean it should be deleted. Instead, it should be investigated carefully.
Check whether the observation was recorded correctly.
Decide whether the individual belongs in the population being studied.
Compare the regression relationship with and without the point.
Report clearly if conclusions depend heavily on that observation.
A high-leverage point may represent a valid but rare case. If it is real and relevant, it may deserve to stay in the analysis even if it changes the model. The important issue is recognizing its effect and communicating that effect honestly.
Practice Questions
A scatterplot of and shows one point far to the right of all the other points. Based on this information alone, what can you say about the point, and what additional check is needed to determine whether it is influential?
1 mark: States that the point has high leverage or has an unusual -value.
1 mark: States that you must check whether removing the point substantially changes the fitted regression relationship or line.
A data set is used to fit a regression line. One observation has an -value much larger than all the others. With the observation included, the slope of the fitted line is 4.8. When the observation is removed, the slope changes to 1.3 and predicted values for many individuals decrease noticeably.
a) Explain why the observation has high leverage.
b) Is the observation influential? Justify your answer.
c) Explain why this example shows that high leverage and influence are different ideas.
d) State one reason a statistician should investigate the observation before deciding how to report the model.
a) 1 mark: Explains that the point has an unusual or extreme -value relative to the rest of the data.
b) 2 marks: 1 mark for saying yes, it is influential; 1 mark for justifying that removing it substantially changes the regression relationship, shown by the large slope change and changed predictions.
c) 1 mark: Explains that a point can have high leverage because of its x-position, while influence depends on how much the fitted line changes.
d) 1 mark: Gives a valid reason, such as checking whether the value was recorded correctly, whether the case belongs in the population, or whether conclusions depend too much on one observation.
FAQ
Yes. A small group of observations can shape the fitted line together.
If those points all occur at unusual $x$-values, removing only one may not change the line much.
Removing the whole group can reveal that the regression relationship depended on them collectively.
This is why analysts sometimes examine clusters of unusual cases, not just one point at a time.
Two fitted lines may be fairly close near the center of the data but farther apart near the ends of the $x$-range.
Near the center, many observations help anchor the line.
Near an extreme $x$-value, a change in slope has a bigger effect.
So one influential point can have a modest impact on some predictions and a large impact on others.
Cook’s distance is a numerical diagnostic that many statistics programs use to flag observations that may be influential.
It reflects both:
how unusual a point is in the explanatory direction
how much the fitted model changes because of that point
In AP Statistics, influence is usually judged from graphs and from comparing regression results, but software measures can support that judgment.
Yes. An influential point is not automatically an error.
It may represent a rare but real case.
It may provide information about an important extreme part of the explanatory range.
It may reveal that the relationship behaves differently for extreme observations.
The key issue is not whether the point is inconvenient. The key issue is whether it is real, relevant, and interpreted honestly.
Study design can make high-leverage points either expected or unexpected.
If the explanatory variable was intentionally measured across a wide range, extreme $x$-values may be planned and informative.
If most observations were supposed to come from a narrow range, an extreme $x$-value may be more surprising and may deserve closer checking.
So leverage is seen in the data, but its meaning depends on how the data were collected.
