
AP Syllabus focus: 'An outlier in regression does not follow the overall trend of the data and has a large residual when the LSRL is calculated.'
When a regression model is used, some observations may stand apart from the main pattern. Recognizing these unusual points is important because they can weaken predictions and change how the relationship is interpreted.
What is an outlier in regression?
In regression, each observation is compared with the value predicted by the fitted line. The most important question is not simply whether a point has a high or low response value, but whether it matches the pattern formed by the rest of the data.
Residual: The difference between an observed response value and the value predicted by the regression line.
Residuals measure how far points are from the line in the vertical direction.

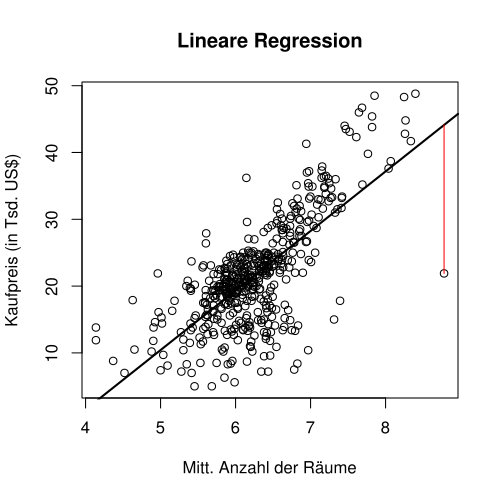
A labeled scatterplot illustrating a single residual as a vertical segment between the observed point and the predicted point on the regression line. The figure makes it visually clear why the residual is computed as and why “large residual” means a large vertical distance from the fitted trend. Source
A small residual means the line predicts the point fairly well, while a large residual means the point is much farther from the fitted pattern.
= residual
= observed response value
= predicted response value from the least-squares regression line
A residual can be positive or negative. A positive residual means the actual point lies above the line, and a negative residual means the actual point lies below the line. For identifying outliers in regression, the size of the residual matters more than its sign.
Outlier in regression: An observation that does not follow the overall trend of the data and has a large residual when the regression line is calculated.
This definition shows why outliers in regression are about the relationship between two variables. A point can look extreme in a scatterplot because of its location, but if it still sits close to the fitted trend, it is not an outlier in regression. The key issue is whether the point is much farther from the line than most of the other observations.
How to recognize an outlier in regression
A good identification process is straightforward:
fit the regression line to the data
compare the observed points with the predicted pattern from that line
look for observations with residuals that are much larger in magnitude than the rest
judge the point relative to the overall scatter, not in isolation
Because regression is based on a pattern across all observations, outliers are identified after the line is fitted. This is important. A point may not seem unusual until you compare its observed response with the predicted response. That is why the residual is the central tool for recognizing a regression outlier.
What it looks like on a scatterplot
On a scatterplot, an outlier in regression appears as a point that is noticeably far above or below the line suggested by the data. The visual clue is a large vertical distance from the overall trend. If nearly all points cluster close to the pattern and one point stands off on its own vertically, that point is a strong candidate.
However, visual inspection should be careful. If the scatter itself is wide, a point needs to be clearly more separated than the rest before it should be described as an outlier in regression.
What it looks like in the residuals
A two-panel display showing (top) a scatterplot with a least-squares line and (bottom) the corresponding residual plot. It helps students see that each residual is a vertical difference between an observed point and its predicted value, and that unusually large residuals stand out clearly in the residual plot. Source
When residuals are calculated, an outlier in regression usually stands out as one observation with a residual whose magnitude is much larger than the others.
Textbook example figures showing a scatterplot with a fitted line (Figure 12.11) and the corresponding residual plot (Figure 12.12). Together they demonstrate how residual plots summarize vertical deviations from the regression line, making unusually large residuals easy to spot compared with the overall pattern. Source
In AP Statistics, this is usually described in comparative language, such as saying the point has a large residual or is far from the predicted value.
Why outliers in regression matter
Outliers matter because regression is meant to describe the overall relationship between an explanatory variable and a response variable. If one or more observations do not follow that relationship, the line may not represent the data as well as it seems at first glance.
A regression outlier can:
make predictions for some observations much less accurate
increase the overall amount of unexplained variation around the line
signal that the chosen linear model does not describe every observation equally well
require extra caution when interpreting the fitted relationship
In written statistical interpretation, it is not enough to say that a point is “weird” or “far away.” You should connect the point to the model by stating that it does not follow the overall trend and has a large residual.
How to describe an outlier in context
On AP Statistics questions, descriptions should use the variables named in the problem. Strong responses usually include three ideas:
identify the unusual observation in context
state that it does not follow the overall regression trend
mention that its residual is large, and note whether it is above or below the predicted value
This keeps the description statistical rather than casual. It also shows that you understand that the outlier is being judged relative to the regression model, not just by whether the data value is unusually large or small on its own.
Common misunderstandings
One common mistake is treating any extreme response value as an outlier in regression. That is not always true. If an observation has a very high or very low response but still lies close to the regression line, then its residual is small and it is not a regression outlier.
Another mistake is focusing only on the appearance of the scatterplot without referring to the fitted line. Outliers in regression are tied to the model. The line must be part of the reasoning.
A third mistake is forgetting that large residuals can be either positive or negative. A point far above the line and a point far below the line can both be outliers in regression if each fails to follow the overall pattern.
Finally, avoid vague wording. Phrases such as “does not fit the trend,” “lies far from the predicted value,” and “has a large residual” are much more precise and statistically correct for AP Statistics than informal comments about a point looking strange.
Practice Questions
A least-squares regression line is used to predict quiz scores from hours of study. One student has an actual score of 92, but the regression line predicts 81. Most other residuals are between -3 and 3.
Explain why this student may be considered an outlier in regression.
1 mark: Identifies that the residual is large, such as , or states that the point has a much larger positive residual than the others.
1 mark: Explains that the observation does not follow the overall regression trend or lies far above the predicted value.
A researcher fits a regression line relating daily temperature to iced coffee sales. Most days lie close to the line, but one day has actual sales much lower than predicted.
(a) What does it mean to say this day is an outlier in regression?
(b) Would the residual for this day be positive or negative? Explain.
(c) Give one reason the researcher should mention this point when interpreting the regression model.
(a) 2 marks
1 mark: States that the day does not follow the overall trend of the data.
1 mark: States that the day has a large residual compared with the other observations.
(b) 1 mark
1 mark: Negative residual, because the actual sales are below the predicted sales.
(c) 2 marks
1 mark: Explains that the point can make the model less representative of the data overall or increase prediction error.
1 mark: Gives a clear interpretation in context of the regression model.
FAQ
No. First check whether the point came from a data-entry mistake, a measurement error, or some other recording problem.
If the value is real, it should usually stay in the data set. A real outlier may represent an important exception, a special condition, or evidence that the model does not explain every case well.
Common causes include:
recording or measurement errors
unusual conditions for one observation
an important variable missing from the model
a data set that mixes different groups together
An outlier does not automatically mean the data are wrong. It may show that something important happened for that observation.
Yes. More than one observation can have a large residual.
If that happens, the issue may be broader than a single unusual case. It can suggest that the relationship changes under some conditions, that there are hidden groups in the data, or that the fitted linear model is not adequate for all observations.
A regression outlier depends on the paired values, not on one variable alone. An observation can have a fairly typical $x$ value and a fairly typical $y$ value when viewed separately, yet the combination may not match the overall relationship.
That is why scatterplots and regression analysis can reveal unusual observations that single-variable displays do not show.
Usually, no. Changing units changes the numerical size of the residuals, but it does not usually change which observations are farthest from the fitted relationship.
For example, converting a response variable from inches to centimeters multiplies all residuals by the same constant. The same observation will still stand out relative to the others if it was already an outlier.
