
AP Syllabus focus:
‘Essential Knowledge: VAR-3.E.3 focuses on how statistically significant differences between treatment groups serve as evidence of the treatment's effect. The subsubtopic will explore the concept of statistical significance in depth, explaining how it supports causal inferences about the relationship between treatments and observed outcomes.’
Understanding when observed differences between treatment groups are meaningful is essential in experimental design, as statistical significance helps determine whether results genuinely reflect treatment effects rather than chance variation.
Evidence of Treatment Effects
Understanding Treatment Effects in Experiments
In an experiment, researchers apply treatments to experimental units to observe how outcomes differ across groups. When comparing results, a central question arises: Do differences in response variables reflect a real treatment effect, or are they merely due to random variability? The concept of statistical significance helps answer this question by evaluating whether observed differences are unlikely to have occurred by chance alone.
Statistical Significance and Its Role
The term statistical significance refers to the assessment that an observed difference between treatment groups is too large to reasonably attribute to random assignment variation.
Statistical Significance: A result is statistically significant if the likelihood of the observed difference occurring by chance (or a more extreme difference) is sufficiently small.
A statistically significant difference supports the idea that the treatment itself may have caused the observed change, aligning with the AP Statistics emphasis on connecting significance with evidence of a treatment’s effect.
How Random Assignment Supports Inference
Random assignment ensures that treatment groups are comparable at the start of an experiment. Because random assignment distributes potential confounding variables roughly evenly across groups, any differences observed after treatment are more plausibly attributed to the treatment rather than uncontrolled factors.
This foundational structure allows researchers to use statistical significance to evaluate whether the treatment truly produced an effect. Evidence of a treatment effect grows stronger when:
Groups were assigned randomly.
The difference in outcomes between groups is large relative to expected chance variability.
The probability of obtaining such a difference by chance is small.
Assessing Statistical Significance Through Simulated Distributions
Statistical significance in AP Statistics often relies on the randomization distribution, which models what differences in outcomes might look like if there were no actual treatment effect. This process allows students to compare the observed result to a distribution of results generated purely by chance.
The logic of this approach involves:
Assuming no true treatment effect (the null hypothesis).
Simulating many repetitions of randomly shuffling treatments and calculating a statistic (such as a difference in means or proportions).
Evaluating where the observed statistic falls relative to the simulated distribution.
If the observed statistic lies far in the tail of the distribution, the result is considered statistically significant.
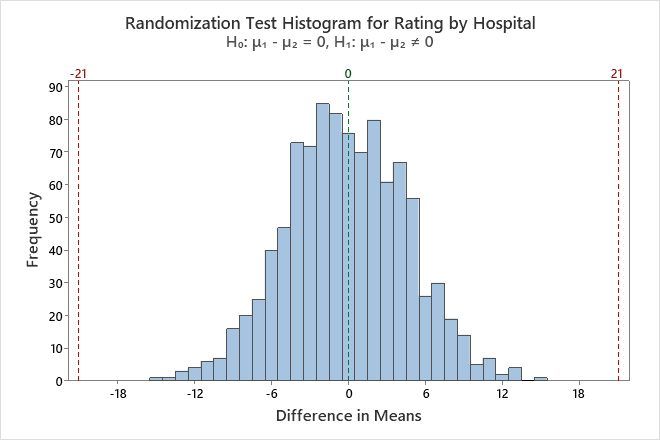
This histogram displays a randomization test for the difference in mean ratings between two hospitals. The dashed lines mark the observed statistic and its symmetric counterpart, while the shaded tails show outcomes as extreme as the observed result. A small tail area corresponds to a small p-value and strong evidence for a treatment effect. Source.
EQUATION
= Chance-based measure used to evaluate statistical significance
The p-value provides a quantitative measure of how unlikely the observed result would be if no treatment effect existed.
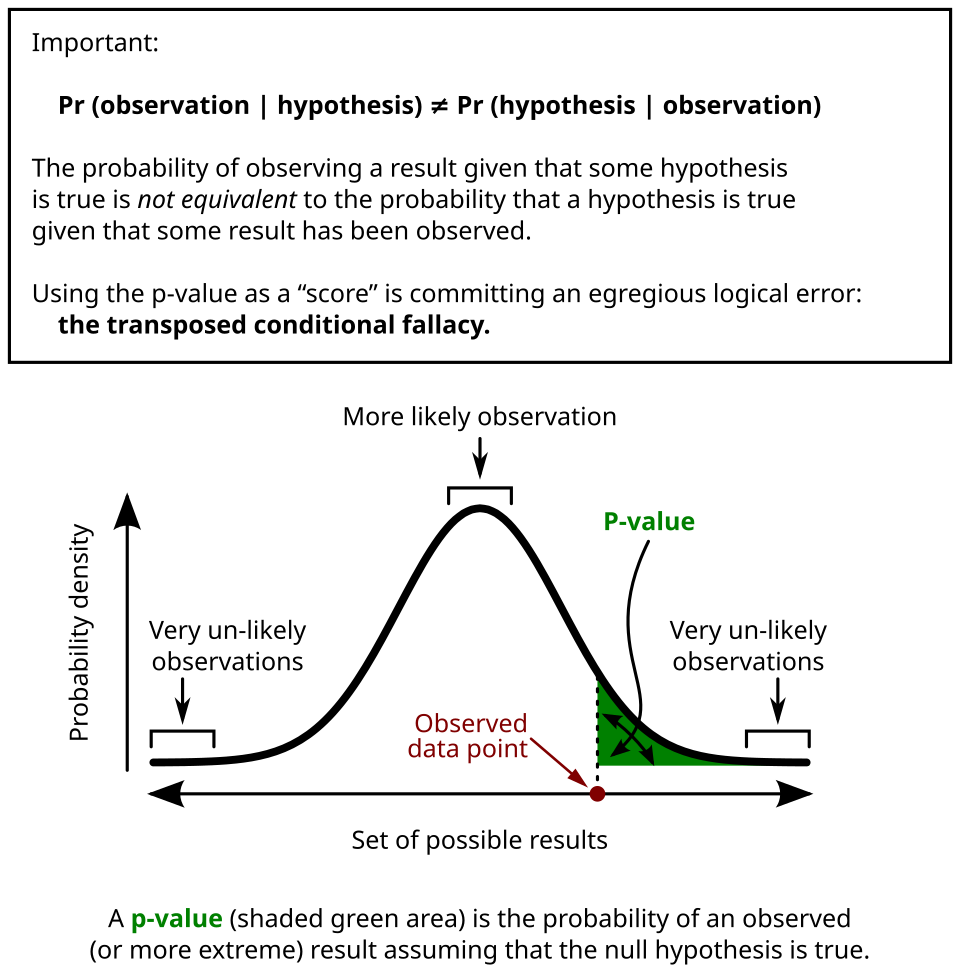
This diagram shows a null distribution with an observed test statistic and a shaded tail region indicating the p-value. The shaded area represents outcomes as extreme as the observed result under the assumption of no treatment effect. Smaller shaded regions signify stronger evidence against the null hypothesis and in favor of a real treatment effect. Source.
Interpreting Statistical Significance in Context
A statistically significant result offers evidence that the treatment caused a change in the response variable. However, statistical significance does not measure the size or practical benefit of the treatment effect; it merely indicates that the effect is unlikely to be due to chance alone.
Important interpretive guidelines include:
A small p-value indicates evidence of a treatment effect, supporting causal inference when random assignment was used.
Statistical significance does not guarantee a large or meaningful impact.
A lack of significance does not prove there is no treatment effect; it may reflect insufficient sample size or high variability.
Distinguishing Evidence of Treatment Effects from Other Sources of Variation
Experiments inherently include two types of variability:
Random variation, resulting from natural differences among individuals.
Systematic variation, resulting from applying different treatments.
Statistical significance helps distinguish systematic variation from random variation. When the difference between treatment groups exceeds what would typically be expected from random variation alone, researchers interpret this as evidence of a treatment effect.
Key Indicators of Reliable Evidence
To evaluate whether treatment effects are convincingly demonstrated in an experiment, AP Statistics students should assess:
Random assignment: Ensures fairness and comparability across groups.
Sample size: Larger samples lead to more stable and reliable distributions of outcomes.
Magnitude of observed difference: Larger effects are easier to distinguish from chance variation.
Contextual interpretation: Statistical significance must be explained within the real-world framework of the experiment.
Organizing Thinking With a Treatment-Effect Framework
Students can analyze evidence of treatment effects by considering:
What was the observed difference?
How much variation is expected due to random assignment alone?
Is the observed difference unusual relative to this expected variability?
What does this imply about the effectiveness of the treatment?
Bullet points help clarify this reasoning process:
Identify the response variable and the comparison being made.
Determine the method of random assignment.
Examine the randomization distribution or p-value.
Decide whether the observed difference is statistically significant.
Connect significance to causal reasoning, emphasizing that random assignment justifies such conclusions.
Importance Within the AP Statistics Framework
This subsubtopic reinforces the AP Statistics goal of helping students understand that statistically significant differences provide evidence of a treatment’s effect. Through random assignment and the evaluation of chance variability, experiments allow for justified causal conclusions that extend beyond descriptive summaries.
FAQ
Statistical significance indicates that the observed difference is unlikely to be due to chance, but the strength of evidence can also be evaluated by considering the effect size and the consistency of results across subgroups or repeated studies.
Researchers may look at:
• The magnitude of the difference between treatments.
• The variability within each treatment group.
• Whether results remain stable when analysing different parts of the data.
These elements help determine whether the evidence is convincing in a broader scientific context.
The randomisation distribution should be roughly centred at zero when there is no true treatment effect. Its shape determines how likely extreme values are under the null scenario.
A distribution that is wide or skewed means that large differences could occur purely by chance, weakening the evidence from any single observed difference.
A narrow, symmetric distribution makes extreme values rarer, so a similar observed difference would provide stronger evidence of a real treatment effect.
Yes. Statistical significance reflects the unlikeliness of the overall pattern arising by chance, not whether every individual responds similarly.
However, substantial individual variability can complicate interpretation. It may:
• Reduce the practical usefulness of the treatment.
• Suggest that different subgroups respond differently.
• Prompt further investigation into why individuals vary in their responses.
Significance alone does not guarantee consistent or predictable effects.
A very large sample size can produce tiny p-values even for effects that are trivial in magnitude.
Other factors include:
• Poor implementation of random assignment leading to accidental imbalance between groups.
• Measurement error that inflates differences in unpredictable ways.
• Multiple testing, where many comparisons increase the chance of obtaining a rare outcome by chance.
These issues highlight the need to consider study design quality and practical significance alongside statistical significance.
A p-value just above a traditional threshold (for example, 0.051 instead of 0.05) does not indicate that no treatment effect exists; it simply means the evidence is weaker.
Interpretation can be improved by examining:
• The direction and magnitude of the observed difference.
• Confidence intervals to understand the range of plausible effects.
• Whether the study had enough power to detect meaningful effects.
Borderline results should be viewed as suggestive rather than definitive.
Practice Questions
Question 1 (1–3 marks)
A researcher randomly assigns 40 volunteers to one of two treatments aimed at improving concentration. After one week, the mean concentration score in Treatment A is noticeably higher than in Treatment B. A randomisation test shows that only 3% of simulated differences in means were as large as or larger than the observed difference.
Explain what this result indicates about the evidence of a treatment effect.
Mark scheme:
• 1 mark: States that the observed difference is unlikely to be due to chance alone.
• 1 mark: Recognises that a small p-value (3%) provides evidence against the assumption of no treatment effect.
• 1 mark: Concludes that the higher scores in Treatment A give evidence of a real treatment effect.
Question 2 (4–6 marks)
A school wants to test whether a new revision programme improves student performance. Fifty students are randomly assigned to either the new programme or the standard revision approach. After the exam, the randomisation distribution of the difference in mean scores (new minus standard) is centred at 0, and only 2% of simulated differences are as large as the observed result.
(a) Explain why random assignment is essential in this experiment.
(b) Using the information from the randomisation distribution, determine whether the results provide evidence of a treatment effect.
(c) Comment on what the result does and does not tell the school about the practical importance of the programme.
Mark scheme:
(a)
• 1 mark: States that random assignment makes the groups comparable at the start.
• 1 mark: States that it controls for confounding variables, allowing differences to be attributed to the treatment.
(b)
• 1 mark: Identifies that only 2% of simulated results being as extreme indicates a small p-value.
• 1 mark: Concludes this gives evidence that the new programme has a real effect on performance.
(c)
• 1 mark: States that statistical significance does not necessarily imply practical significance.
• 1 mark: States that while the programme appears effective, the magnitude or real-world benefit of the improvement is not provided by the p-value alone.
