
AP Syllabus focus:
‘UNC-3.G & UNC-3.G.1: Discuss how to interpret probabilities and parameters (mean and standard deviation) of a geometric distribution within specific contexts, emphasizing the importance of using appropriate units and considering the relevant population or scenario. This includes understanding the implications of these statistical measures for real-life situations and decision-making processes.’
Geometric distributions help describe situations where the goal is to understand the likelihood and behavior of the trial count until the first success, and interpreting these distributions is essential for drawing meaningful conclusions. These notes explain how to contextualize probabilities and parameters so they accurately reflect real scenarios.
Interpreting Geometric Distributions
Interpreting a geometric distribution involves understanding what the probability model tells us about the underlying process, the behavior of repeated independent trials, and the expected number of trials until success. Interpretation must always be tied to the real-world context that generated the data.
Understanding the Role of Context
Context determines what success, failure, and a trial represent.

A diagram illustrating Bernoulli trials with two outcomes and fixed probabilities, reinforcing the foundation of geometric distributions based on repeated independent trials. Source.
A geometric random variable is defined immediately after it is introduced to ensure clarity.
Geometric Random Variable: A random variable representing the number of independent Bernoulli trials required to achieve the first success, each with constant probability of success p.
When interpreting any probability or parameter from a geometric distribution, ensure that the description of success and the sequence of trials aligns with the situation. Without grounding the interpretation in context, numerical values lose their meaning.
A geometric distribution is memoryless, meaning the probability of success on the next trial remains constant regardless of prior outcomes. This property should inform how students interpret ongoing processes.
Interpreting Probabilities in Context
Probabilities generated by a geometric distribution indicate the likelihood that the first success occurs on a specific trial number. These probabilities demonstrate exponential decay, meaning the probability decreases with each additional required trial.
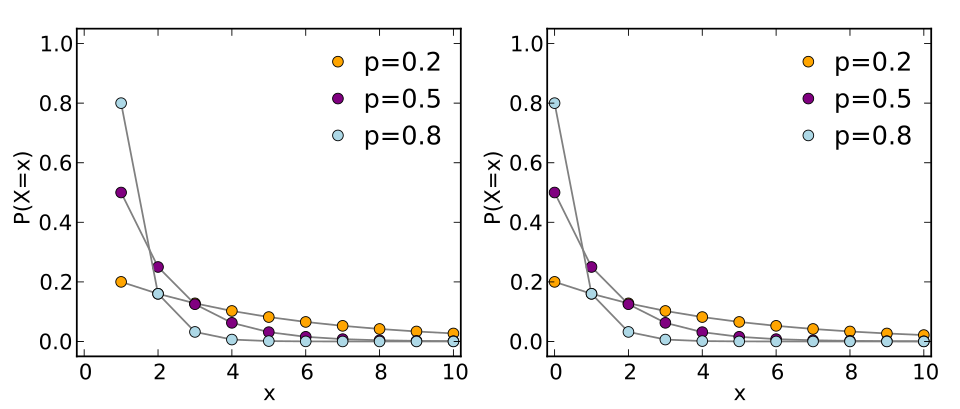
A pair of geometric PMF plots showing how probabilities decline with increasing trial number and how different success probabilities reshape the distribution. Source.
When discussing the probability that success occurs on a particular trial, interpretations should use consistent language that ties probability statements to the action taking place. For example, phrasing such as “the chance that the first success occurs on the xth repetition of the process” preserves alignment with the geometric framework.
Key features to consider when interpreting probabilities include:
The probability of success p is the same for every trial.
Each additional trial without success reduces the probability that the first success has not yet occurred.
Probabilities should be linked directly to time, attempts, or repetitions, depending on the scenario.
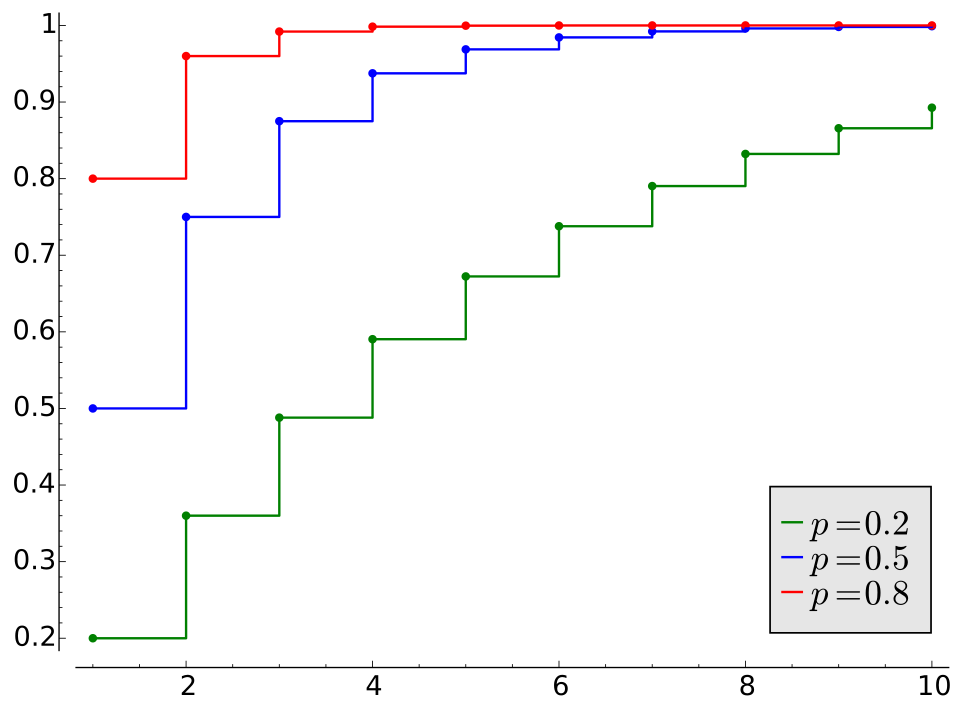
A cumulative geometric distribution plot demonstrating how probability accumulates as more trials occur, with higher success probabilities leading to faster increases. Source.
Interpreting Parameters: Mean and Standard Deviation
The mean and standard deviation of a geometric distribution summarize its long-run behavior. These parameters do not describe single outcomes but long-run expectations over many repetitions of the process.
EQUATION
= Mean number of trials until the first success (measured in trials)
= Standard deviation of the number of trials until the first success (measured in trials)
These parameters must always be interpreted with explicit reference to units. Since the geometric random variable counts trials, both the mean and standard deviation describe the distribution in terms of trial counts, not probabilities.
The mean conveys the center of the distribution. It represents the average number of trials required to obtain the first success across many repetitions of the scenario. The standard deviation measures the variability in the number of trials needed for the first success, helping students understand how dispersed the outcomes may be around the mean.
Applying Interpretation to Real-World Scenarios
When interpreting geometric distributions in practical contexts, students should consistently address:
What constitutes a trial
What counts as success
What the value of p represents
How the parameters relate to the population or scenario
To create clear, accurate interpretations, consider the following guidelines:
Always identify the time unit or repetition unit connected to the trials.
State explicitly what the parameters tell us about that unit.
Use language such as “on average,” “typically,” or “in the long run” for parameter-based interpretations, since these values are expected long-run characteristics rather than literal single-trial predictions.
Communicating Statistical Meaning
Effective interpretation requires precise and context-bound language. Some strategies include:
Linking probability statements to the specific trial number.
Emphasizing the predictive nature of long-run averages rather than short-term expectations.
Clarifying that geometric probabilities decrease as the required number of trials increases.
Highlighting how unit consistency ensures meaningful parameter interpretation.
When geometric distributions are interpreted thoughtfully and contextually, they provide powerful insights into processes governed by repeated independent attempts until success is observed.
FAQ
A meaningful interpretation links the numerical value directly to the real process being modelled, specifying what a trial and a success represent.
A purely numerical description repeats the value without tying it to context.
A strong interpretation answers: “What does this value tell us about the situation over many repetitions?”
Independence ensures that the probability of success remains constant and that earlier outcomes do not influence future ones.
This makes long-run interpretations valid, as the expected pattern of successes does not shift over time.
If independence is violated, the meaning of parameters such as the mean and standard deviation becomes unreliable.
Large values often represent cases where repeated failures occurred before the first success, which is entirely possible in geometric settings.
To interpret them:
• Link the large value to what repeated failures imply in context.
• Discuss whether such an outcome is surprising given the value of p.
• Avoid assuming it reflects a change in the underlying process.
The memoryless property implies that the chance of success remains the same regardless of how many failures have already occurred.
This affects interpretation by preventing statements like “success becomes more likely after repeated failures.”
Instead, interpretations must reflect that each trial is essentially a fresh start.
Standard deviation reflects how variable the number of trials until success can be. To communicate uncertainty clearly:
• Avoid implying that most outcomes cluster tightly around the mean unless p is high.
• Describe the spread using contextual units (such as attempts, days, or actions).
• Clarify that variability reflects long-run patterns, not guaranteed bounds for a single run.
Practice Questions
A teacher records the number of attempts a student takes to correctly solve a particular type of puzzle. Each attempt is independent, and the probability of success on any attempt is 0.25.
Using the context, interpret the mean of the geometric distribution for this scenario.
(1–3 marks total)
• 1 mark: States that the mean is the long-run average number of attempts needed for the first correct solution.
• 1 mark: Connects the mean specifically to the puzzle attempts in context (e.g., “On average, the student would take about four attempts to solve the puzzle correctly”).
• 1 mark: Refers correctly to the interpretation being about long-run behaviour, not a single attempt.
A company tests a new voice-recognition system. Each trial consists of a user giving a spoken command, and a trial is considered a success if the system processes the command correctly.
The probability of success on each independent trial is 0.6. Let the random variable X represent the number of trials needed until the first success.
(a) Interpret the value of the mean in context.
(b) Interpret the value of the standard deviation in context.
(c) Explain why the geometric distribution is appropriate for modelling X in this scenario.
(4–6 marks total)
(a) (1–2 marks)
• 1 mark: States that the mean indicates the long-run average number of trials required for the first correctly processed command.
• 1 mark: Provides correct contextual interpretation tied to the voice-recognition system (e.g., “On average, the system will process the command correctly on the second trial”).
(b) (1–2 marks)
• 1 mark: States that the standard deviation measures the variability in the number of trials until the first success.
• 1 mark: Gives a correct contextual interpretation linked to the command-processing process (e.g., “There is moderate variation in how many trials are needed before the system processes a command successfully”).
(c) (1–2 marks)
• 1 mark: States that each trial has only two outcomes (success or failure) and the probability of success is constant.
• 1 mark: States that the trials are independent and that X counts the number of trials until the first success, making the geometric model appropriate.
