
AP Syllabus focus:
‘Enduring Understanding VAR-5 & Learning Objective VAR-5.B: Focus on interpreting probability distributions, including understanding how they provide information about the shape, center, and spread of a population. VAR-5.B.1: Emphasize how interpretations can lead to conclusions about the population of interest, facilitating a deeper understanding of the statistical significance and implications of probability distributions.’
Interpreting probability distributions helps reveal meaningful characteristics of populations by examining how values are arranged, how often they occur, and what patterns emerge from their variability.
Understanding the Purpose of Interpretation
Interpreting a probability distribution involves analyzing how the possible outcomes of a random variable are spread out and how likely each value is. This interpretation allows statisticians to infer characteristics of a broader population from the distribution's structure. When students interpret a distribution, they focus on three essential features: shape, center, and spread, each offering different insights into the underlying random behavior.
Identifying the Shape of a Probability Distribution
The shape of a probability distribution refers to the general form created by plotting its values and associated probabilities. Interpreting shape helps determine whether data values cluster in certain regions or stretch across a range of possible outcomes. Key shape-related information can indicate the nature of the processes generating the data.
Common descriptive characteristics of distribution shape include:
Symmetry: A symmetric distribution has identical behavior on both sides of its center.
Skewness:
Right-skewed distributions have most probability mass on lower values with a long tail toward higher values.
Left-skewed distributions have most probability mass on higher values with a tail toward smaller values.
Modality:
Unimodal distributions have one clear peak.
Bimodal or multimodal distributions have multiple peaks, suggesting varied underlying processes.
Understanding shape is critical because it influences how the center and spread should be interpreted and informs what conclusions are reasonable about the population represented by the distribution.
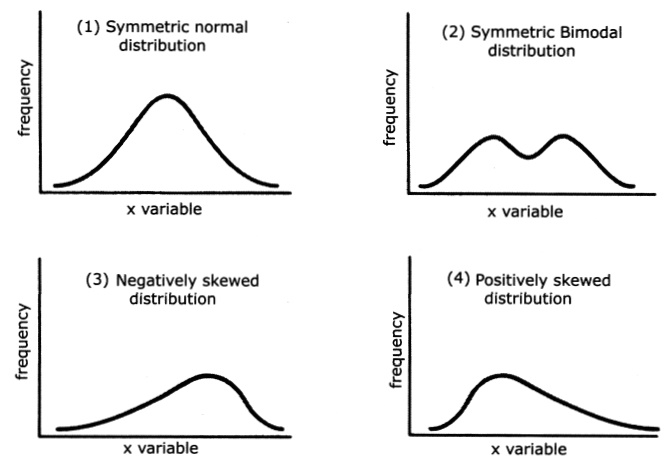
This image illustrates symmetric, bimodal, negatively skewed, and positively skewed distributions, highlighting how the concentration of probability and tail behavior determine a distribution’s shape. Although drawn using continuous examples, the same interpretive principles apply to probability distributions more broadly. Source.
Determining the Center of a Probability Distribution
The center describes the typical or expected value of the random variable. For discrete random variables, this idea is closely linked to the mean, which summarizes where the distribution tends to cluster.
Mean (Expected Value): The long-run average value of a random variable based on its probability distribution.
Interpreting the center helps describe what value the random variable would approach over a very large number of repeated observations. The center provides a reference point from which other characteristics, such as spread, can be understood. It anchors the interpretation of the distribution in terms of what is typical for the population.
Between the center and the shape, students gain a clearer perspective on how the distribution behaves overall.
Examining the Spread of a Probability Distribution
The spread of a probability distribution reflects how much the values of a random variable vary. Greater spread indicates more variability, while smaller spread suggests that outcomes are consistently near the center.
Spread: A measure of how dispersed or variable the values of a random variable are within a probability distribution.
Spread provides essential insight into the reliability and predictability of outcomes. A narrow distribution implies less uncertainty in the population, while a wide distribution reflects greater diversity in possible values.
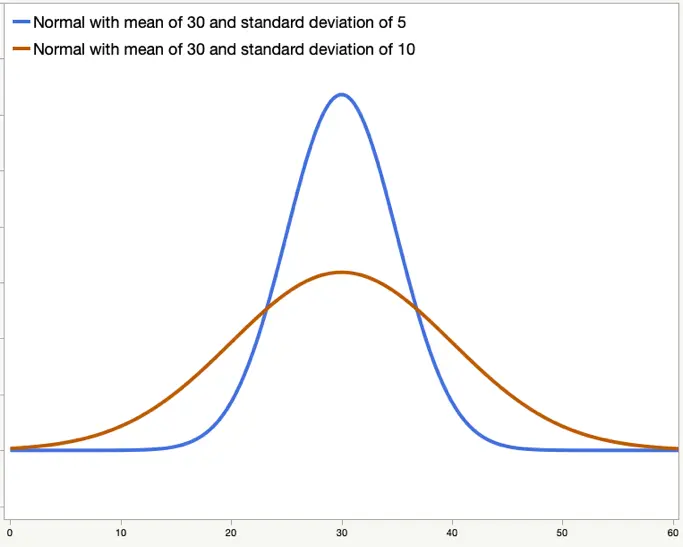
These two normal curves share the same mean but have different standard deviations, visually demonstrating how a narrow curve indicates low variability while a wider curve reflects greater spread. Although illustrated with normal distributions, the concept of spread applies to all probability distributions. Source.
Interpreting spread equips students to assess how stable or volatile outcomes may be in the long run.
Connecting Distribution Features to Population Characteristics
Interpreting probability distributions goes beyond simply labeling characteristics. Students use shape, center, and spread to draw meaningful conclusions about the population of interest.
Important interpretive goals include:
Identifying trends suggested by how probability mass is allocated across values.
Recognizing unusual or extreme outcomes by comparing them to the distribution's center and variability.
Describing long-run behavior, an essential aspect of statistical interpretation grounded in relative frequency.
Assessing population differences, especially when comparing multiple distributions.
These interpretations rely on understanding that a probability distribution is a model representing the behavior of a random variable over many repeated trials. As students learn to interpret these features, they develop the ability to make informed statements about the real-world processes and populations the distribution approximates.
Using Interpretations to Draw Statistical Conclusions
Once students understand the structure of a probability distribution, they can apply this knowledge to make conclusions supported by statistical reasoning. According to the specification, interpretations should help determine what the distribution suggests about the population. This may include identifying central tendencies, recognizing variability, or determining whether patterns imply specific characteristics of the underlying random process.
Interpreting distributions therefore serves as a bridge between abstract probability models and real-world statistical insight. Students who master these interpretive skills gain a deeper appreciation of how probability distributions guide our understanding of populations and support evidence-based conclusions.
FAQ
When a distribution is strongly skewed or has multiple peaks, measures like the mean may not fully represent its typical value. In such cases, analysts may rely more heavily on the median or qualitative descriptions of the distribution’s form.
Skewed or irregular shapes also influence how spread is interpreted, since extreme values on one side can inflate variability even if most of the probability mass is concentrated elsewhere.
Shape provides insight into underlying behaviours that numerical summaries alone may miss. Two distributions can share the same centre and spread yet differ dramatically in symmetry, skewness, and modality.
When comparing two distributions, considering shape helps determine whether differences arise from overall shifts, increased variability, or distinct processes producing multiple clusters of outcomes.
Long-run relative frequency links theoretical probability distributions to real-world behaviour by suggesting how often values occur across many repetitions.
This perspective clarifies why the centre represents a typical outcome and why spread reflects how much variation would appear in repeated observations. It offers an intuitive bridge between theoretical models and empirical performance.
Yes. Identical numerical summaries do not guarantee identical behaviour. Differences in shape can lead to meaningful distinctions in how values are distributed.
For example:
• A unimodal distribution concentrates probability around one region, while a bimodal distribution divides it across two.
• A skewed distribution may produce more extreme outcomes in one direction than another.
These differences influence interpretation even when centre and spread coincide.
Interpretation helps identify what outcomes are typical, how much variability exists, and whether certain values are unusually likely or unlikely.
For decision-makers, this might involve:
• Assessing the predictability of a process.
• Anticipating potential extremes.
• Evaluating whether observed patterns align with expectations.
By focusing on shape, centre, and spread, interpretations allow predictions and planning based on probabilistic behaviour rather than isolated observations.
Practice Questions
Question 1 (1–3 marks)
A discrete probability distribution for a random variable X is given below.
Value of X: 0, 1, 2, 3
Probability: 0.1, 0.4, 0.3, 0.2
Using the information provided, identify the shape of the distribution (e.g., symmetric, skewed, unimodal, bimodal) and justify your answer.
Question 1 (1–3 marks)
• 1 mark: Correctly identifies the distribution as unimodal.
• 1 mark: Notes that the highest probability occurs at X = 1 (one clear peak).
• 1 mark: Recognises slight right skew, since probabilities decline as X increases after the peak, and explains this observation.
Maximum: 3 marks.
Question 2 (4–6 marks)
A researcher is studying the distribution of the number of customer complaints received per day by a small company. The probability distribution for this random variable is unimodal and left-skewed.
(a) Explain what is meant by the shape of a probability distribution and describe what a left-skewed shape implies in this context.
(b) The researcher comments that “the centre of the distribution reflects the number of complaints expected on a typical day”. Explain what is meant by the centre and why it is useful here.
(c) Discuss how the spread of this distribution would help the company understand the consistency of the number of daily complaints.
Question 2 (4–6 marks)
(a)
• 1 mark: Defines shape as the general pattern or form of the distribution when probabilities are plotted.
• 1 mark: States that left skew implies most probability mass is on higher complaint counts, with a tail extending to fewer complaints.
(b)
• 1 mark: Defines the centre as the typical or expected value of the random variable (e.g., mean).
• 1 mark: Explains relevance: indicates what the company would expect on an ordinary day.
(c)
• 1 mark: States that spread indicates how much the number of complaints varies from day to day.
• 1 mark: Explains that a small spread suggests consistent complaint levels, while a large spread indicates substantial day-to-day variability.
Maximum: 6 marks.
