
AP Syllabus focus:
‘Probabilities and parameters for a sampling distribution for a sample proportion must be interpreted with appropriate units and within the context of a specific population. This involves understanding how the theoretical distribution relates to practical, real-world scenarios and making inferences about population parameters based on sample data.’
Interpreting probabilities and parameters for a sampling distribution of a sample proportion requires connecting mathematical quantities to real populations, emphasizing context, appropriate units, and clear statistical reasoning.
Interpreting Probabilities and Parameters in Sampling Distributions for Sample Proportions
Understanding how to interpret probabilities and parameters for a sampling distribution of a sample proportion is central to making valid inferences about a population. A sampling distribution describes how a sample statistic behaves across repeated random samples of the same size from the same population.
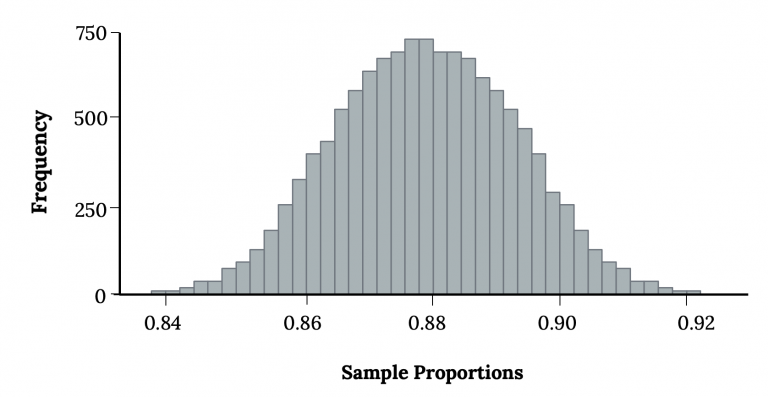
A histogram showing simulated sample proportions from thousands of random samples, illustrating how most values cluster near the true population proportion and fewer fall in the tails. Source.
When the statistic of interest is the sample proportion (written as p-hat, or ), its sampling distribution allows us to attach probability-based statements to possible sample outcomes and reason about what they imply for the population proportion p.
The Role of Context in Interpretation
In AP Statistics, every probability statement must be grounded in real-world context. Because sample proportions describe categorical outcomes, such as the proportion of students who prefer online learning, each interpretation must reference the specific population and variable being studied. Without context, probabilities lose meaning and cannot guide decision-making.
Students must remember that probabilities in a sampling distribution describe the long-run relative frequency of observing particular sample proportions under repeated sampling using the same method.
Key Parameters of the Sampling Distribution of
Two parameters define the sampling distribution for a sample proportion drawn from a population with true proportion p:
The mean of the sampling distribution, which equals p, represents the long-run center of all possible sample proportions.
The standard deviation of the sampling distribution, sqrt(p(1-p)/n), measures how much the sample proportion is expected to vary across random samples of size n, assuming sampling with replacement or a sample size less than 10% of the population.
These parameters allow analysts to reason about how close a typical sample proportion is likely to be to the population proportion.
EQUATION
mu_(p-hat) = p
mu_(p-hat) = Mean of the sampling distribution of p-hat (population proportion)
p = True population proportion (unitless)
sigma_(p-hat) = sqrt[p(1-p)/n]
sigma_(p-hat) = Standard deviation of p-hat (unitless)
n = Sample size (number of individuals in the sample)
These formulas support probability interpretations by quantifying how sample proportions behave under repeated sampling.
Interpreting Probability Statements
Probability statements involving p-hat describe how likely it is to observe a sample proportion in a particular range when sampling from the population. When interpreting these statements, the following principles apply:
Always reference the sampling method, such as taking a random sample of size n from the specified population.
Describe the variable of interest, such as the proportion of adults who own electric vehicles.
Avoid interpreting the probability as a guarantee for a single sample; probabilities apply to the long run, not to isolated instances.
When a normal approximation is applicable, such as when np ≥ 10 and n(1-p) ≥ 10, probabilities associated with intervals can be interpreted as areas under an approximately normal sampling distribution curve. However, the interpretation must still be contextual and focused on what sample proportions represent in the real world.
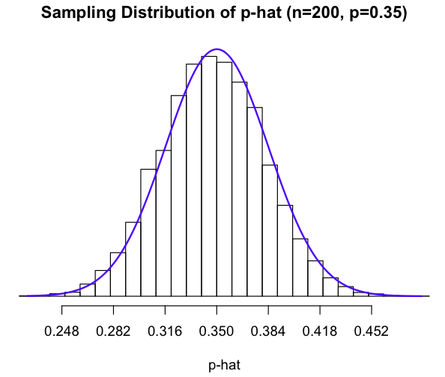
A histogram of a sampling distribution of p-hat with a superimposed normal curve, illustrating how centre and spread relate to the true proportion and sample size when normal approximation is appropriate. Source.
Using Units and Population Descriptions Appropriately
Because sample proportions represent percentages or fractions of categorical outcomes, interpretations must emphasise units such as “proportion,” “percentage,” or “fraction.” To align with AP expectations:
Identify the population (e.g., “all voters in the state”).
Identify the sample proportion being measured (e.g., “the sample proportion who support Policy A”).
Maintain consistent units across all probability and parameter statements.
Incorrect interpretations often stem from omitting one of these elements or confusing sample proportions with counts.
Connecting the Theoretical Distribution to Real-World Inference
Interpreting probabilities and parameters requires understanding how the theoretical sampling distribution translates into insights about population behaviour. This connection is essential when:
Assessing whether a sample result is typical or unusual.
Determining whether sample evidence supports or contradicts a claim about the population proportion.
Evaluating the strength of evidence in statistical inference procedures such as confidence intervals and significance tests.
To make this connection, probability statements must explicitly relate the behaviour of sample proportions back to the population parameter p, emphasising that observed outcomes reflect random variation inherent in sampling.
Practical Guidelines for Clear Interpretation
Tie every probability and parameter to the context of the specific population and variable being studied.
State parameters in population terms, not sample terms.
Interpret probabilities as long-run frequencies, not certainties for single samples.
Use units consistently, focusing on proportions or percentages.
Differentiate between sample statistics and population parameters, highlighting the role of random variation.
Frame conclusions about populations, not about individual sample members.
FAQ
Larger samples produce sampling distributions of p-hat that are more tightly concentrated around the true population proportion. This means probability statements become more informative because unusual results are easier to detect.
Smaller samples produce more variable p-hat values, so probability statements must be interpreted with greater caution, as even large deviations can occur simply due to chance.
Probabilities describe how p-hat behaves across repeated sampling from a specific population. Without naming that population, the interpretation becomes ambiguous and statistically meaningless.
Stating the population ensures clarity about what proportion is being estimated and what real-world context the probability applies to.
Yes. Even if both populations share the same true proportion, differences in sampling methods, sample sizes, or the meaning of the variable can change the interpretation.
The probability must always refer to the particular characteristic and population under study, not just the numerical value of the proportion.
Incorrect interpretations often:
Refer to individual outcomes rather than long-run sample behaviour
Omit the sampling process or population
Suggest certainty rather than probability
Confuse sample proportions with counts or unrelated variables
A correct interpretation requires both the number and the contextual explanation.
If a sample proportion falls in a region with very low probability under the assumed population proportion, this may indicate that the claim is doubtful.
Such evaluations rely on understanding how unusual the observed p-hat is within the sampling distribution, linking real data to the theoretical behaviour expected if the claim were true.
Practice Questions
Question 1 (1–3 marks)
A random sample of 180 customers is taken from a population in which the true proportion of customers who prefer contactless payment is 0.63.
Explain the meaning of the probability statement:
P(p-hat < 0.58) = 0.12.
Your answer must refer to the context.
Question 1 (1–3 marks)
1 mark: Identifies that the probability refers to long-run relative frequency across repeated random samples.
1 mark: States that the probability refers to the sample proportion, not individual customers.
1 mark: Provides correct contextual interpretation, e.g. “About 12% of random samples of 180 customers would produce a sample proportion less than 0.58.”
Maximum: 3 marks.
Question 2 (4–6 marks)
A wildlife researcher claims that 55% of birds in a region migrate south each year. The researcher repeatedly takes random samples of 250 birds and records the sample proportion p-hat of birds that migrate.
(a) In context, explain what the mean of the sampling distribution of p-hat represents.
(b) In context, explain what the standard deviation of the sampling distribution of p-hat represents.
(c) The researcher finds that P(p-hat > 0.61) = 0.09. Interpret this probability in context and explain what it suggests about how unusual such a sample result is under the claim.
Question 2 (4–6 marks)
(a) Mean of sampling distribution (1–2 marks)
1 mark: Recognises it as the expected value of p-hat across repeated samples.
1 mark: Gives correct context, e.g. “On average, the sample proportion of birds that migrate will be close to 0.55, the claimed population proportion.”
(b) Standard deviation (1–2 marks)
1 mark: States that it measures the typical variation in p-hat from sample to sample.
1 mark: Gives correct context, e.g. “It indicates how much the sample proportion of migrating birds tends to vary in repeated samples of 250.”
(c) Interpretation of P(p-hat > 0.61) = 0.09 (1–2 marks)
1 mark: States that this probability describes the long-run frequency of such sample results.
1 mark: Provides contextual interpretation and comments on unusualness, e.g. “About 9% of random samples would give a sample proportion above 0.61, which suggests such a result is somewhat unusual but still possible if the true proportion is 0.55.”
Maximum: 6 marks.
