
AP Syllabus focus:
‘The null hypothesis (H0) represents the status quo or a specific value of the population proportion (p0) that is assumed true until evidence suggests otherwise. The alternative hypothesis (Ha) represents the claim to be tested and is supported by evidence. It contains a strict inequality indicating a one-sided (greater than or less than) or two-sided (not equal to) test. Null hypothesis: H0: p = p0. Alternative hypothesis examples: Ha: p < p0 (one-sided), Ha: p > p0 (one-sided), Ha: p ≠ p0 (two-sided).’
Hypothesis formulation establishes the foundation of statistical testing by defining the claims being evaluated about a population proportion and determining the direction of the proposed alternative.
The Purpose of Hypothesis Formulation
Formulating hypotheses creates a structured comparison between an assumed population proportion and the value suggested by sample evidence. In inference for a single proportion, this framing determines how evidence will be evaluated using a one-sample z-test for a population proportion.
Before constructing hypotheses, it is essential to understand that every significance test begins with a claim treated as “innocent until proven guilty.” This role belongs to the null hypothesis, which contrasts with the alternative hypothesis, the claim for which the researcher seeks supporting evidence.
The Null Hypothesis
The null hypothesis (H0) represents the status quo, a benchmark proportion, or a statement of no change. It assigns a specific numeric value to the population proportion.
Null Hypothesis (H0): A statement claiming that the population proportion equals a specific value, , and assumed true unless disproven by evidence.
The null is expressed using an equality: H0: p = p0. It does not reflect what the researcher hopes to prove; instead, it provides a reference against which evidence is tested. Selecting requires contextual relevance, such as a historical rate or a regulatory standard.
Hypothesis formulation uses the null as the anchor for calculating expected outcomes and assessing how unusual the sample proportion would be if the null were correct.
The Alternative Hypothesis
The alternative hypothesis (Ha) makes a directional or non-directional claim about the population proportion and identifies what the researcher aims to support with data. It must contrast meaningfully with the null.
Alternative Hypothesis (Ha): A statement describing the direction or existence of a difference between the population proportion and the value specified in the null hypothesis.
The alternative is always written with a strict inequality and chooses one of three forms:
One-Sided (Greater Than or Less Than)
A one-sided alternative states that the population proportion is either greater than or less than the hypothesized value. It is used when context implies the difference can only logically occur in one direction.
Examples include:
Ha: p > p0
Indicates interest in whether the proportion exceeds the hypothesized rate.
Ha: p < p0 Indicates interest in whether the proportion falls below the hypothesized rate.
These forms limit the “extreme outcomes” considered when calculating the p-value to one tail of the sampling distribution.
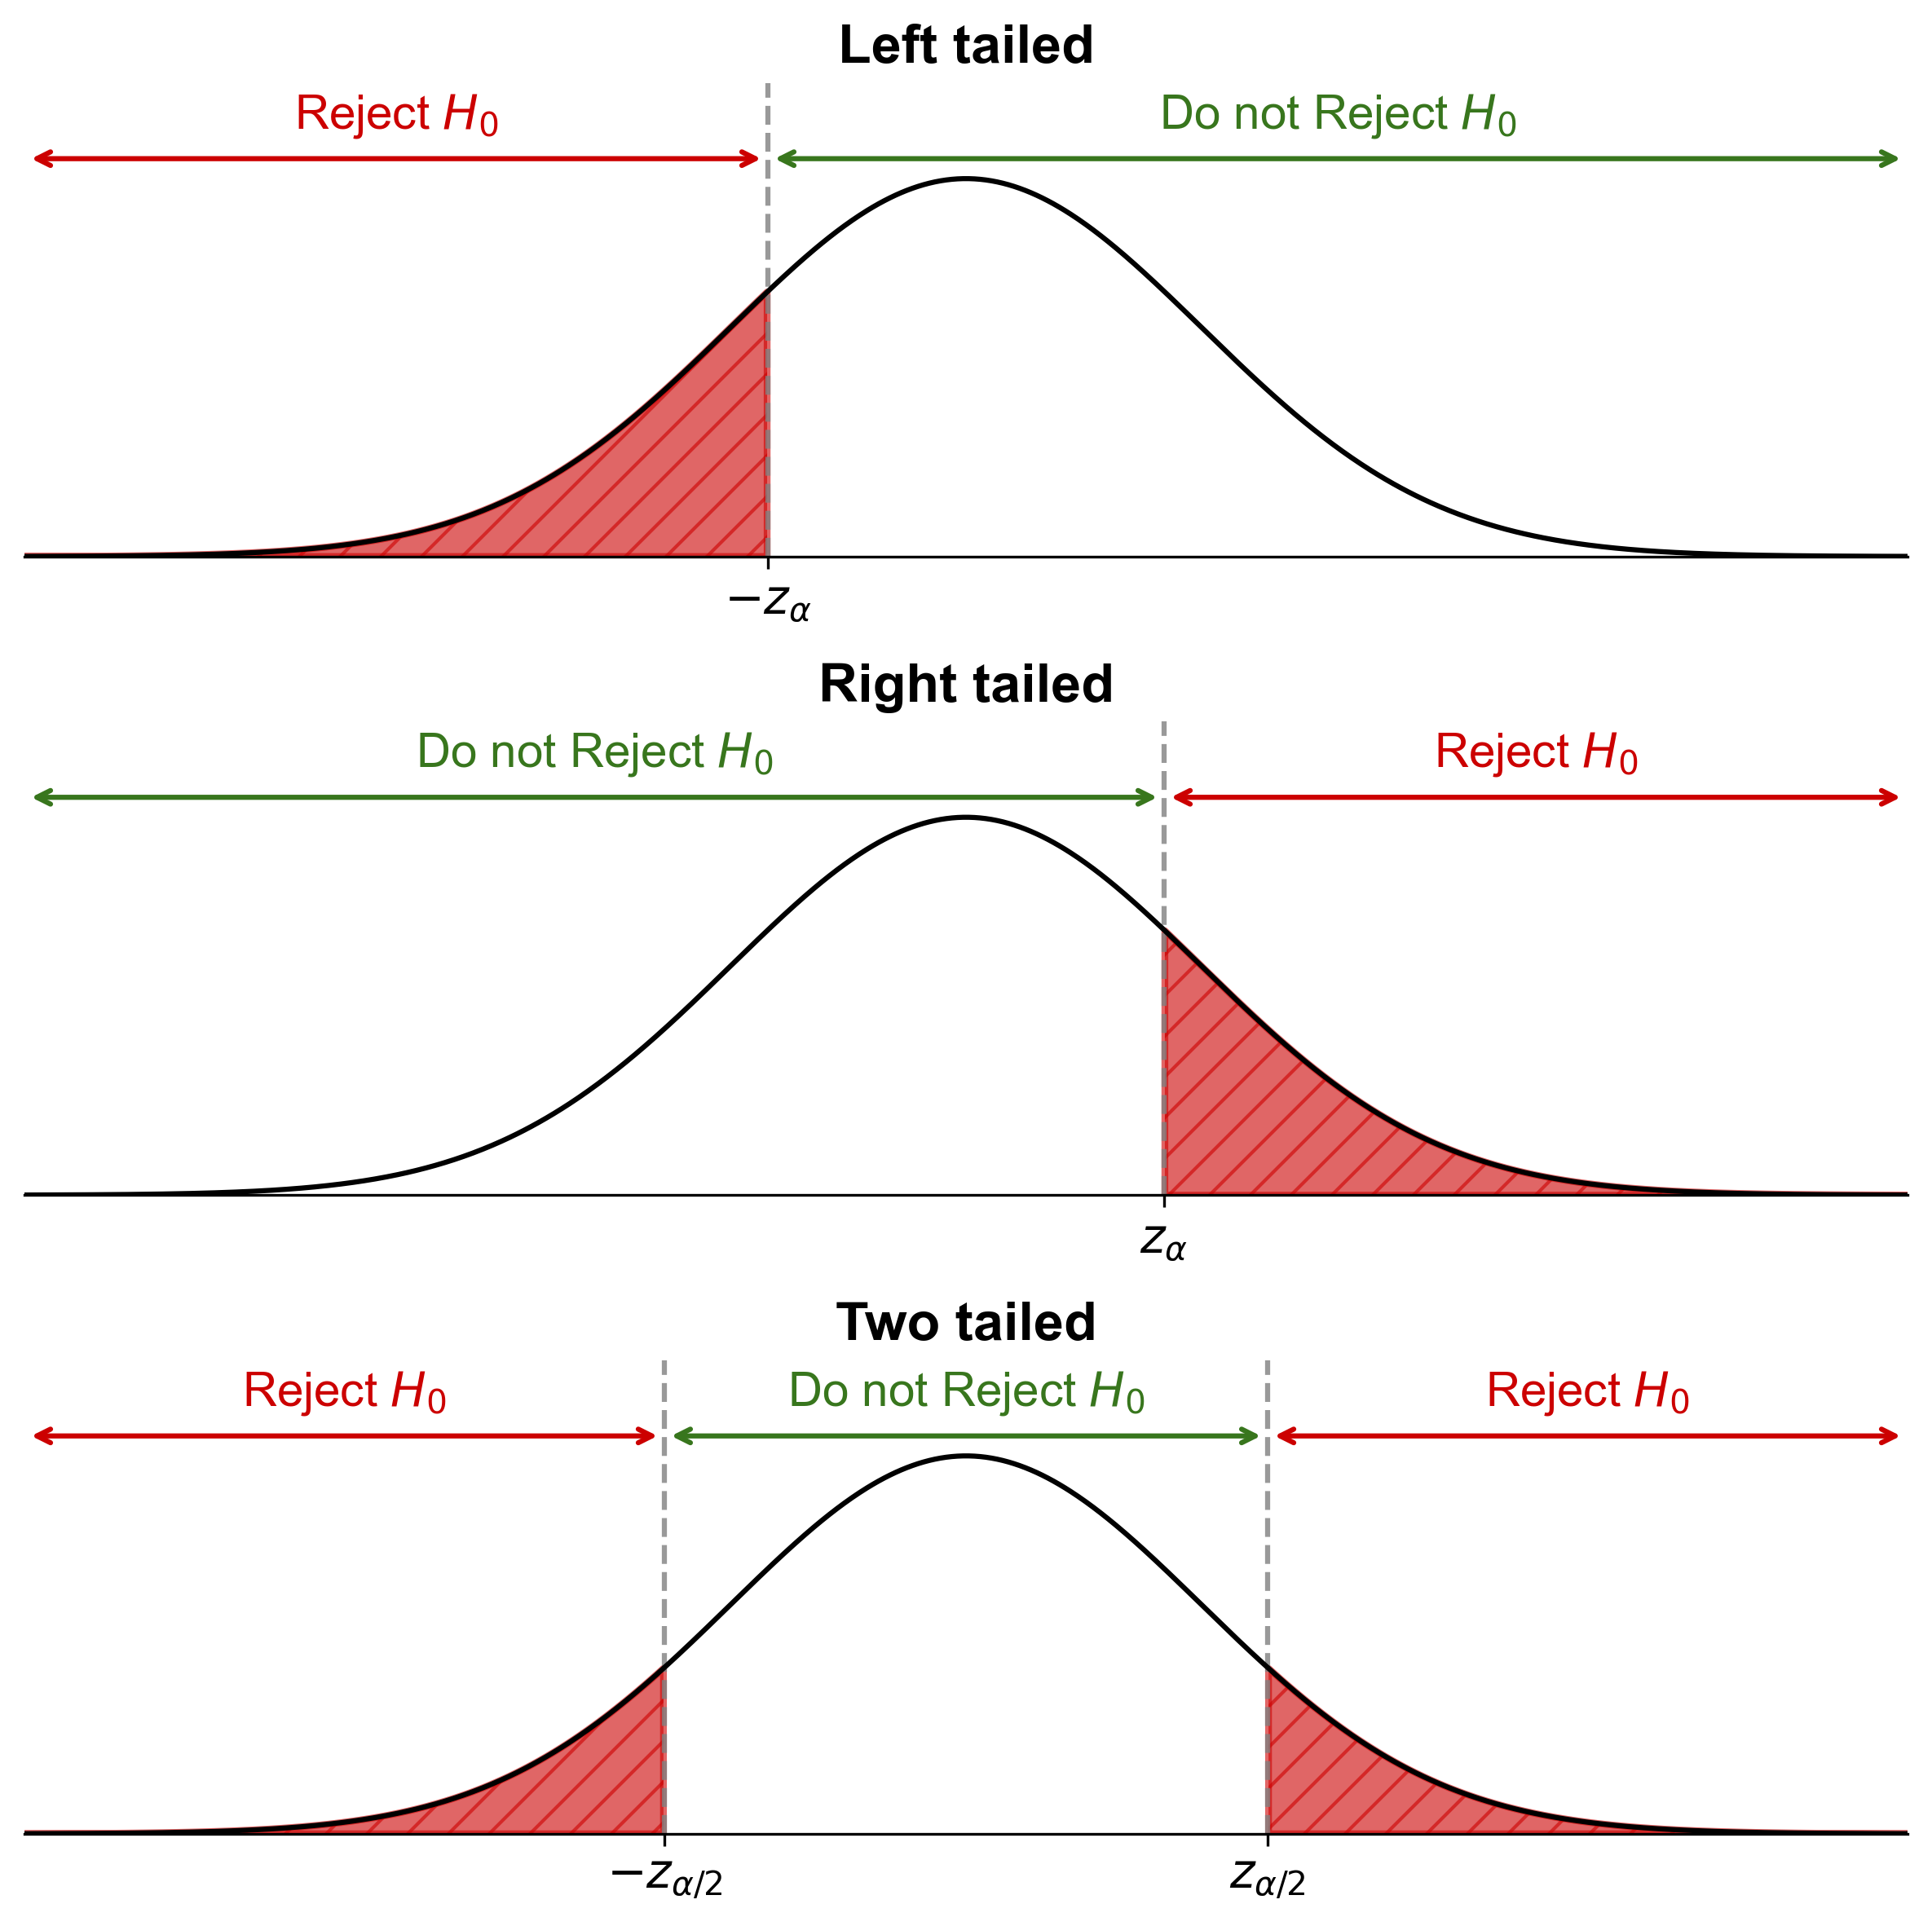
This diagram compares left-tailed, right-tailed, and two-tailed hypothesis tests by shading rejection regions where H0H_0H0 would be rejected. It visually connects each form of HaH_aHa to the part of the sampling distribution that provides evidence against the null. Some labels illustrate concepts that appear in later inference topics beyond this specific subsubtopic. Source.
Two-Sided (Not Equal To)
A two-sided alternative states that the population proportion is simply different from the hypothesized value, without committing to a direction.
Ha: p ≠ p0
This form is appropriate when any deviation from the null value is meaningful. Two-sided tests are more conservative because evidence must be strong enough to support a departure on either side.
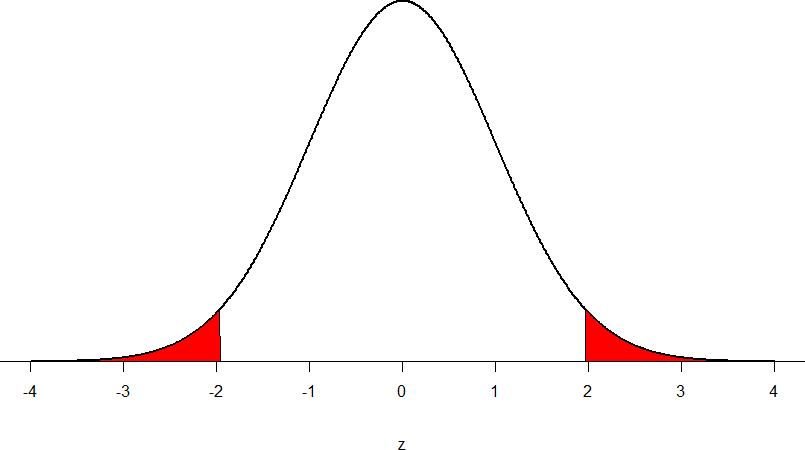
This diagram presents a two-tailed hypothesis test with symmetric shaded rejection regions representing where results would be considered too extreme under H0H_0H0. It shows that evidence against the null can occur in either direction. The figure also includes critical value markers relevant to inference topics that extend beyond this subsubtopic. Source.
How Hypotheses Work Together
The hypotheses always appear as a pair, and together they establish the assumptions needed for inference:
H0 specifies what is assumed to be true.
Ha specifies what the researcher seeks to show.
Because all calculations for the test statistic and p-value are based on the assumption that H0 is true, the null hypothesis affects the structure of the sampling distribution used for inference.
Establishing clear hypotheses ensures the test is logically aligned with the research question. A mismatch between the question and the form of Ha can lead to incorrect interpretation or loss of statistical power.
Choosing the Correct Form of the Alternative
Selecting an appropriate alternative requires attention to study context:
Use Ha: p > p0 when increases are meaningful or expected.
Use Ha: p < p0 when decreases are meaningful or expected.
Use Ha: p ≠ p0 when any difference matters, or when direction is not predictable beforehand.
Researchers should determine the direction before collecting data to avoid bias. Changing Ha after seeing the data undermines the validity of the test.
Role of Hypothesis Formulation in Inference
Hypothesis formulation does not determine the outcome of the test but instead shapes how the evidence is evaluated. Once H0 and Ha are established:
The null defines the expected sampling distribution.
The alternative determines where evidence is sought (upper tail, lower tail, or both tails).
The significance test later compares observed results to these expectations.
Because the entire inferential process depends on correctly written hypotheses, this step is one of the most critical in performing a test for a population proportion.
This clear structure—H0 as an equality and Ha as a strict inequality—ensures that statistical reasoning stays consistent with the AP Statistics framework and supports reliable decision-making in context.
FAQ
The null hypothesis serves as the precise reference value from which the sampling distribution is generated. Without an equality, the test would not have a single value to compare the sample proportion against.
In addition, the equality allows statisticians to compute expected outcomes, probabilities, and test statistics under one clearly defined assumption.
Researchers must decide before collecting data whether they care about change in a specific direction or any difference at all.
• Use a one-sided test when only increases or only decreases carry practical meaning.
• Use a two-sided test when deviations in either direction matter or when no justified directional prediction exists.
This introduces bias and invalidates the significance test. Choosing Ha post-hoc artificially inflates the chance of rejecting the null, because the direction is selected to match the observed result.
Sound statistical practice requires specifying hypotheses in advance to maintain integrity and prevent overstating evidence.
Not in standard AP-level inference. Hypothesis tests require the null to define a single population value, ensuring the sampling distribution is uniquely determined.
Range-based null hypotheses exist in more advanced inference frameworks but fall outside the scope of one-sample proportion tests used in AP Statistics.
The purpose of inference is to draw conclusions about the population, not describe the sample. The sample proportion is an estimate, not the parameter of interest.
Hypotheses are therefore written about p, the true but unknown population proportion, to guide the test’s evaluation of whether the observed data contradict the assumed population value.
Practice Questions
Question 1 (1–3 marks)
A researcher claims that the proportion of students who regularly complete their homework is 0.75. Formulate the null and alternative hypotheses the researcher should use to test whether the true proportion is actually lower than the claimed value.
Question 1
• 1 mark: Correctly identifies the null hypothesis as H0: p = 0.75.
• 1 mark: Correctly identifies the alternative hypothesis as Ha: p < 0.75.
• 1 mark: Uses correct notation and expresses hypotheses clearly as population proportions.
Question 2 (4–6 marks)
A sports analyst believes that the proportion of spectators who prefer online ticket purchases differs from last year’s reported proportion of 0.62.
(a) State the null hypothesis for this investigation.
(b) State the alternative hypothesis.
(c) Explain why the alternative hypothesis must contain a strict inequality and describe what this implies about the direction of the test.
Question 2
• 1 mark: States the null hypothesis as H0: p = 0.62.
• 1 mark: States the alternative hypothesis as Ha: p ≠ 0.62.
• 1 mark: Recognises that the alternative hypothesis must include a strict inequality (<, >, or ≠).
• 1 mark: Explains that strict inequalities reflect the claim being tested and specify the direction or two-sided nature of the test.
• 1 mark: Notes that the direction of the inequality determines which outcomes in the sampling distribution count as evidence against the null.
• 1 mark: Provides a coherent explanation linking the inequality form to hypothesis testing logic (e.g., the null is treated as a specific value to compare against).
