
AP Syllabus focus:
‘Factors that decrease the probability of a Type II error include increasing the sample size, increasing the significance level (α), decreasing the standard error, and the true parameter value being farther from the hypothesized null value.’
A well-designed hypothesis test requires understanding how design choices and underlying population conditions influence Type II error probability, helping ensure stronger and more reliable statistical conclusions.
Factors Affecting Error Probabilities
Understanding Error Probabilities in Context
A Type I error occurs when a true null hypothesis is incorrectly rejected, while a Type II error occurs when a false null hypothesis is not rejected. The probability of a Type I error is denoted α, the significance level, and is set by the researcher before conducting the test. The probability of a Type II error is denoted β, and its complement, 1 − β, is the power of a test. Power represents the probability of correctly detecting an actual difference when the null hypothesis is false.
DEFINITION
Power of a Test: The probability of rejecting a false null hypothesis; calculated as .
Because α and β respond differently to design choices, understanding how each factor influences error probabilities is central to planning effective statistical studies. The syllabus emphasizes how several controllable and uncontrollable factors specifically decrease the probability of a Type II error, thereby increasing the power of a test.
Increasing Sample Size
Increasing the sample size has one of the most substantial effects on reducing the probability of a Type II error. A larger sample yields a more precise estimate of the true parameter, reducing sampling variability and making it easier to detect differences between the sample statistic and the hypothesized value.
Larger samples produce narrower sampling distributions.
With less variability, even small true differences are more likely to be detected.
Increased sample size does not change the significance level α, but it lowers β, improving the test’s ability to detect real effects.
EQUATION
= Standard error of the sample proportion
= Population proportion
= Sample size
A decreasing standard error directly enhances precision, making the test more sensitive to true differences that might otherwise go unnoticed.
Increasing the Significance Level (α)
Raising the significance level, such as choosing α = 0.10 instead of 0.05, reduces the probability of a Type II error because the test becomes more willing to reject the null hypothesis. The rejection region widens, making it easier for the sample statistic to fall into a region that leads to rejecting the null.
A thoughtful selection of α often reflects the practical or ethical consequences associated with errors in real-world settings.
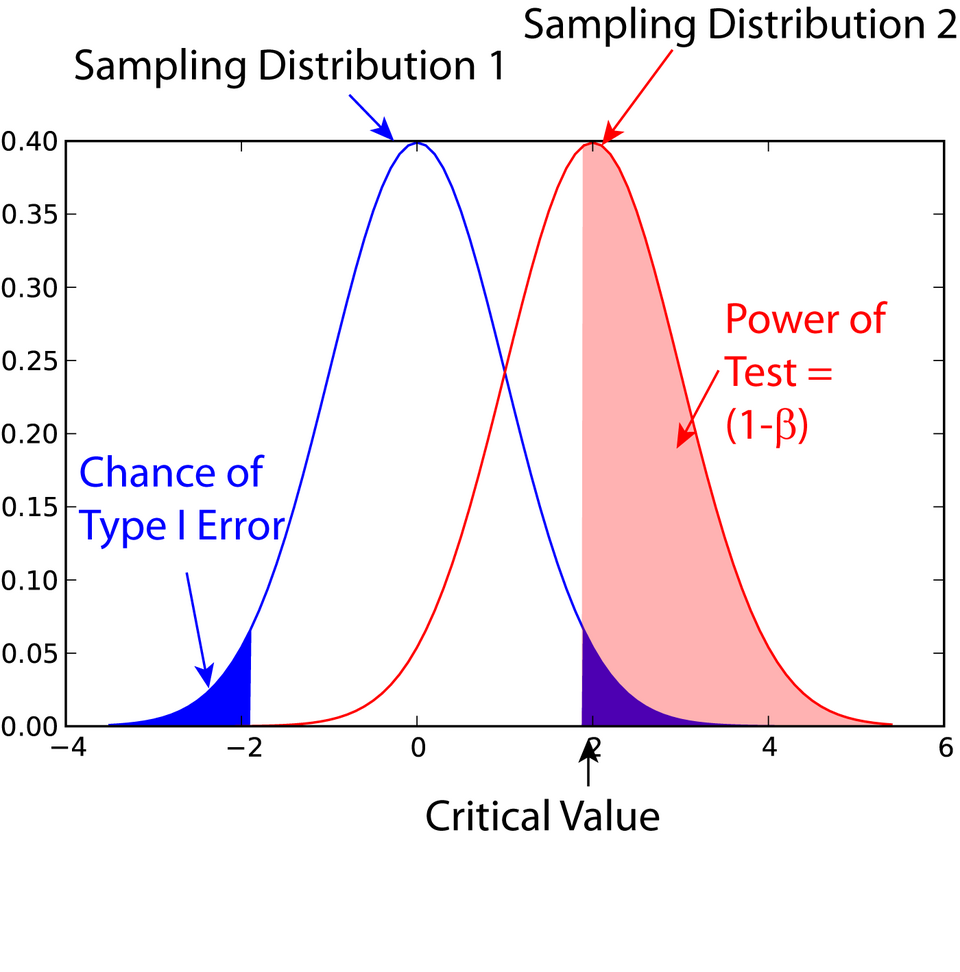
This figure shows the null and alternative distributions with shaded areas for the significance level (α) and power (1 − β), illustrating how adjusting α changes the rejection region and affects Type II error probability. Source.
Decreasing the Standard Error
Reducing standard error strengthens the test by decreasing random variability in the sampling distribution. Although standard error is primarily decreased by increasing sample size, other factors contribute indirectly:
More precise measurement processes reduce noise.
Improved study designs decrease extraneous variability.
In controlled experiments, consistency helps produce more stable estimates.
Because smaller standard error produces a narrower distribution, observed statistics fall farther from the hypothesized value (in standardized units), increasing the likelihood of identifying a meaningful deviation from the null hypothesis.
True Parameter Value Farther from the Hypothesized Value
The magnitude of the true difference between the population parameter and the hypothesized null value plays an important role in determining error probabilities. When the true parameter deviates substantially from the null value, the sampling distribution under the alternative hypothesis shifts farther away from the null distribution.
The farther the truth lies from the hypothesized parameter, the smaller the probability that a sample statistic will appear consistent with the null, decreasing β.
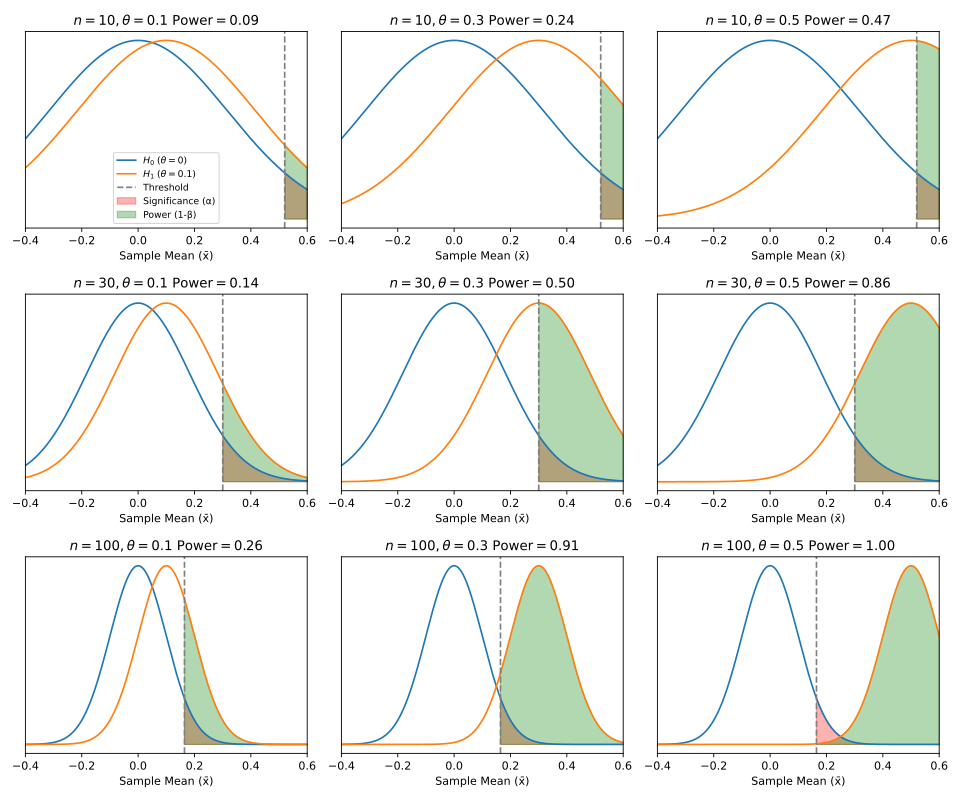
This multi-panel diagram demonstrates how increasing sample size or enlarging the true difference between parameter values separates the null and alternative distributions, increasing power and decreasing Type II error probability. Source.
Interactions Among the Factors
The factors influencing Type II error probability often operate simultaneously, and effective study design involves balancing them:
Increasing sample size boosts power without raising Type I error probability.
Raising α increases power but raises Type I error risk, requiring careful justification.
Reducing standard error strengthens the test’s ability to detect real differences.
When the true parameter strongly differs from the null, even modest sample sizes may yield high power.
A coordinated understanding of these influences helps develop tests that minimize missed detections while respecting acceptable error thresholds.
FAQ
Higher power reduces the risk of overlooking meaningful effects and ensures that study conclusions are more dependable for policy or practical decisions.
Researchers often aim for at least 80% power, balancing feasibility with the consequences of missing a true effect. In fields where missing a real difference is costly, power targets may be set higher.
Researchers can use prior information such as historical effect sizes, expected variability, or preliminary pilot data to estimate likely power.
They may also conduct power analyses, which consider the expected effect size, sample size, and significance level to assess whether the planned design is adequate.
Effect size reflects the magnitude of the true difference, helping determine whether a statistically detectable effect is also practically meaningful.
A small effect may require large samples to reduce Type II error, while a large effect is easier to detect even with modest sample sizes.
Poor sampling methods (such as biased or unrepresentative sampling) can distort estimates, making true differences harder to detect.
Bias cannot be corrected by increasing sample size. If the sample does not reflect the population accurately, the probability of missing a real effect increases.
It is possible, but typically requires a large sample size.
• Lowering Type I error generally increases Type II error unless the sample size increases.
• Sufficiently large samples reduce variability, allowing both error types to remain low while maintaining strong inferential accuracy.
Practice Questions
A researcher is concerned about making a Type II error in a hypothesis test for a population proportion. Identify one change the researcher could make to the study design to reduce the probability of a Type II error and briefly explain why it would be effective.
(1–3 marks)
Question 1 (1–3 marks)
• 1 mark for identifying a valid modification that reduces the probability of a Type II error, such as increasing the sample size, increasing the significance level, reducing standard error, or the true parameter being farther from the null value.
• 1–2 additional marks for a clear and correct explanation of why the modification decreases the probability of a Type II error (for example, larger samples increase precision, a higher significance level widens the rejection region, or a greater true effect size makes differences easier to detect).
Full marks require both identification and explanation.
A public health department is testing whether the true proportion of adults who receive an annual flu vaccination differs from last year’s reported figure of 58%. The department wants to minimise the risk of making a Type II error, as failing to detect a real change could negatively affect planning for vaccine supply.
(a) Explain how increasing the sample size would influence the probability of a Type II error.
(b) Discuss the effect of increasing the significance level on both Type I and Type II error probabilities.
(c) Comment on how the magnitude of the true difference from 58% affects the likelihood of a Type II error.
(4–6 marks)
Question 2 (4–6 marks)
(a)
• 1 mark: Correctly states that increasing sample size reduces the probability of a Type II error.
• 1 mark: Explains that this occurs because larger samples reduce sampling variability or standard error, making real differences easier to detect.
(b)
• 1 mark: States that increasing the significance level increases the probability of a Type I error.
• 1 mark: States that it decreases the probability of a Type II error.
• 1 mark: Provides correct reasoning, such as the rejection region becoming wider, making it easier to reject the null hypothesis when it is false.
(c)
• 1–2 marks: Explains that the further the true population proportion is from 58%, the easier it is to detect the difference, reducing the probability of a Type II error. Clear contextual explanation strengthens the response.
Award 6 marks for complete, accurate, and well-justified answers across all parts.
