
AP Syllabus focus:
‘The consequences of Type I and Type II errors depend on the context of the test. The significance level (α), as the probability of a Type I error, is chosen by considering the relative consequences of making a Type I error versus a Type II error. The decision about the significance level reflects a balance between the risks of Type I and Type II errors, often influenced by the costs, feasibility, and ethical considerations associated with the potential outcomes of the test.’
Understanding how Type I and Type II errors influence statistical decisions is essential, as each error carries different consequences that depend heavily on the study’s real-world context.
Interpreting Type I and Type II Errors in Context
In hypothesis testing for a population proportion, interpreting errors requires attention not only to statistical definitions but also to the broader consequences of decisions. A Type I error occurs when the test incorrectly rejects a true null hypothesis, whereas a Type II error occurs when the test incorrectly fails to reject a false null hypothesis. Because these errors have different impacts depending on the situation, selecting an appropriate significance level (α) requires careful judgment about which type of mistake is more serious for the specific research question.
Type I Error: Rejecting the null hypothesis when it is actually true. Known as a false positive.
A Type I error represents an unwarranted conclusion that an effect or difference exists. In practice, this error may lead to implementing ineffective policies, adopting unsupported medical treatments, or drawing incorrect scientific claims.
Type II Error: Failing to reject the null hypothesis when it is actually false. Known as a false negative.
A Type II error suggests missed detection of a real effect or difference. This might mean overlooking a harmful defect, failing to identify an effective intervention, or underestimating risk in a population. Between these two types of errors, the importance of interpretation relies on understanding which error produces the more severe outcome in the context of the test.
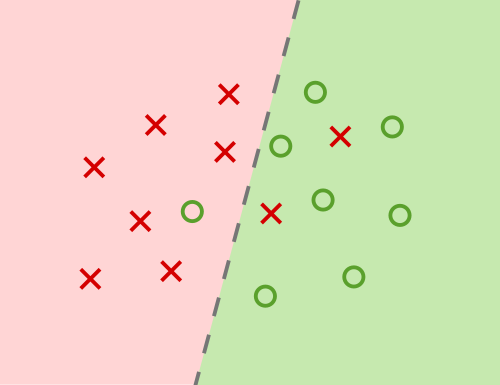
Diagram of decisions in a binary classification setting, illustrating how false positives correspond to Type I errors and false negatives correspond to Type II errors. The graphic also displays precision and recall relationships, which extend beyond the AP Statistics syllabus but help contextualize error types. The visual reinforces how misclassification regions arise from decision boundaries. Source.
Contextual Consequences of Errors
The specification emphasizes that the consequences of Type I and Type II errors depend on context, meaning that the impact of each error is not symmetrical. Decisions in fields such as medicine, manufacturing, public health, and environmental science vary greatly in what constitutes an acceptable risk. Because of this, analysts and researchers must think critically about what each error would imply in their situation before choosing α or interpreting test results.
Evaluating the Severity of Errors
The decision about significance level (α) reflects how willing researchers are to risk a Type I error. Lower α reduces the probability of a false positive but makes a false negative more likely. This trade-off is central to the interpretation of errors. Important considerations include:
Ethical outcomes, such as patient safety or environmental harm.
Financial consequences, including costs of incorrect decisions.
Feasibility constraints, such as limits on data collection or required certainty.
Policy implications, where public trust or regulation may depend on minimizing mistaken claims.
A statistically “small” α is not universally appropriate; instead, context dictates what is acceptable. For example, when false positives carry high risk, α may be set lower. When missing a real effect is more problematic, a higher α may be preferred to reduce Type II errors.
Balancing Type I and Type II Risks
Because α controls the probability of a Type I error, modifying α inevitably influences the likelihood of Type II errors. Increasing α increases sensitivity to real effects but reduces protections against false positives. Thus, researchers must weigh these competing risks when designing hypotheses and interpreting results.
Significance Level (α): The chosen probability threshold for committing a Type I error in a hypothesis test.
Selecting α involves deliberate planning. Typical values such as 0.05 or 0.01 are widely used, but the specification stresses that α should be chosen by considering the relative consequences of Type I and Type II errors. This decision is not purely statistical; it reflects judgment about real-world outcomes.
Normal interpretation practices revolve around the idea that hypothesis testing is never free of uncertainty. Every decision carries the chance of being incorrect, so evaluating hypotheses requires understanding that statistical tests aim to minimize—but cannot eliminate—the risk of error.
Reducing the chance of a Type I error usually increases the chance of a Type II error, because any change in the decision rule shifts how often we make false positives versus false negatives.
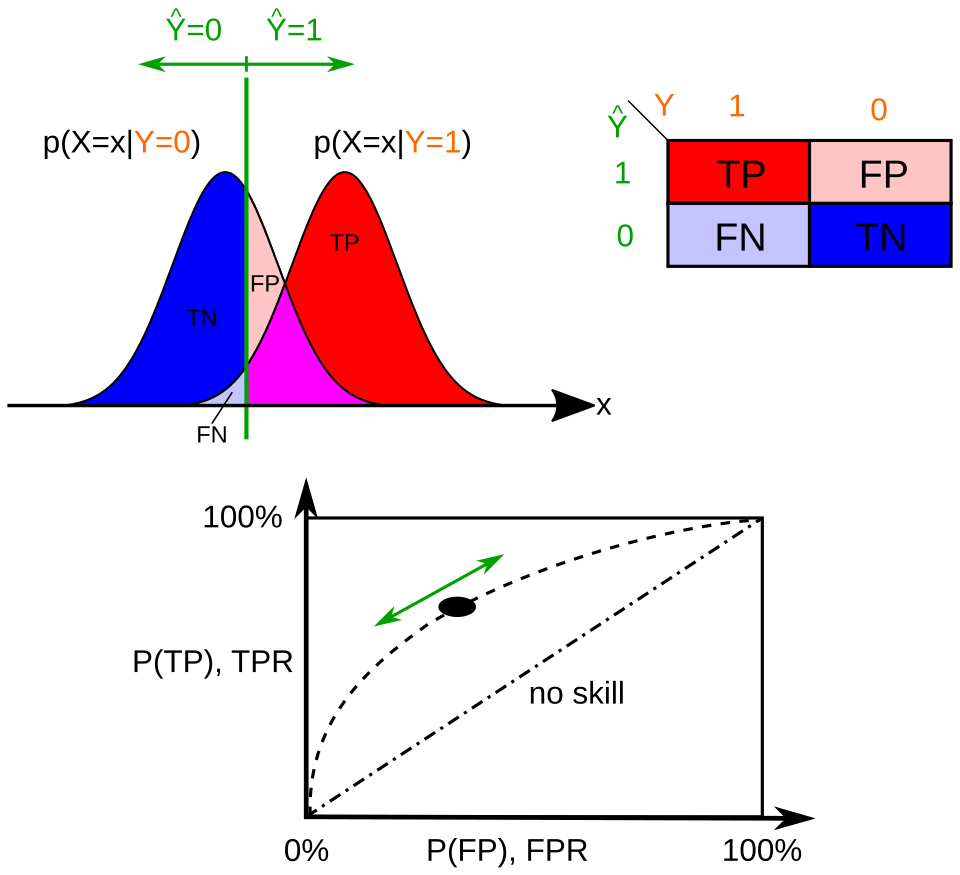
Overlapping distributions depict how a decision threshold determines false positive and false negative regions, illustrating the tradeoff underlying Type I and Type II errors. The associated ROC curve shows how varying the threshold shifts sensitivity and false positive rate, a concept extending beyond AP but reinforcing the relationship between error types. This visual emphasizes why lowering one error rate generally raises the other. Source.
How Context Guides Interpretation
Because the consequences of errors vary, interpreting results means going beyond numerical outputs and considering what those numbers imply in reality. Students must understand how context guides decision-making:
If Type I consequences are severe, interpret results cautiously, emphasizing the strength of evidence required to reject the null.
If Type II consequences are severe, interpretation focuses on whether the test had enough sensitivity (power) and whether a failure to reject may reflect insufficient data rather than true equivalence.
Ethical and practical considerations may override typical conventions, requiring adjustments to testing conditions or significance levels.
Interpreting errors also reinforces that hypothesis testing does not “prove” or “disprove” statements. Instead, the process evaluates whether evidence is compelling enough to justify a particular conclusion in light of the risks associated with potential mistakes. Students should develop the ability to articulate these combined statistical and contextual factors clearly when explaining the outcomes of significance tests.
By incorporating these ideas, interpretation of Type I and Type II errors becomes an informed, context-dependent reasoning process rather than a purely computational task.
FAQ
The seriousness depends on the practical, ethical, and financial consequences of the incorrect conclusion.
Researchers typically consult domain experts to evaluate what harm each error might cause.
• In medical settings, a false negative may endanger patients, making Type II errors more serious.
• In regulatory or safety contexts, a false positive may lead to unnecessary restrictions, making Type I errors more problematic.
This judgement informs the choice of significance level and acceptable risks during decision-making.
Errors arise because hypothesis testing is based on samples rather than full populations. Sampling variability makes uncertainty unavoidable.
Reducing one type of error increases the other because the decision threshold must shift in one direction or the other.
Even extremely large samples only reduce the probabilities; they never eliminate them fully because inference relies on probabilistic models.
This limitation is a fundamental part of statistical reasoning.
Larger samples generally reduce the chance of a Type II error because they provide more precise estimates of population parameters.
With a smaller standard error, real differences become easier to detect.
• Large samples make the sampling distribution narrower.
• A narrower distribution reduces overlap between hypothesised and true values.
• This increases the power of the test, decreasing the probability of failing to detect a real effect.
Thus, sample size planning is critical for minimising Type II errors.
Changing the significance level alters how cautious or permissive the test is in rejecting the null hypothesis.
A lower significance level means stronger evidence is required to reject the null, increasing the likelihood of Type II errors.
A higher significance level means weaker evidence is accepted as sufficient, increasing the probability of Type I errors.
Interpreting errors therefore requires understanding these trade-offs, not merely applying a rule.
A Type II error is more damaging when failing to detect a real effect has serious consequences.
Examples include:
• Missing a harmful defect in manufacturing, allowing unsafe products to enter the market.
• Failing to identify that a medical treatment is effective, preventing its adoption.
• Overlooking early warning signs in environmental monitoring.
In these cases, the cost of an undetected issue outweighs the cost of incorrectly flagging one.
Practice Questions
Question 1 (1–3 marks)
A public health department is testing whether a new screening tool correctly identifies a rare disease. A Type I error in this context would occur if the test incorrectly indicates that a person has the disease when they do not.
a) Identify which type of mistake this represents in terms of hypothesis testing.
b) Briefly explain one consequence of this error in this context.
Question 1
a) (1 mark)
• Correct identification that this represents a Type I error or false positive.
b) (1–2 marks)
• 1 mark for stating a reasonable consequence, such as unnecessary stress for the individual, unnecessary follow-up tests, or misallocation of medical resources.
• A second mark may be awarded if the explanation clearly links the consequence to incorrectly identifying a disease-free person as diseased.
Total: 2–3 marks.
Question 2 (4–6 marks)
A school is evaluating whether a new teaching method increases the proportion of students who pass a standardised exam. Researchers set the null hypothesis as: the proportion of students passing is the same as before. The alternative hypothesis states that the proportion has increased.
a) Describe what a Type II error would mean in this scenario.
b) Explain why the school might consider the consequences of Type I and Type II errors before choosing a significance level.
c) Suggest one reason why a school might choose a relatively high significance level rather than a low one.
Question 2
a) (1–2 marks)
• 1 mark for stating that a Type II error means failing to detect that the new teaching method truly increases the pass rate.
• A second mark for a clear explanation, e.g., the method is actually effective but the test fails to show improvement.
b) (1–2 marks)
• 1 mark for explaining that the consequences of each error differ and must be weighed in context.
• 1 mark for noting that selecting a significance level affects the balance of risks (e.g., reducing Type I errors increases Type II errors).
c) (1–2 marks)
• 1 mark for giving a valid reason, such as wanting to avoid missing a genuinely beneficial teaching method.
• 1 additional mark for a clear justification linking a higher significance level to reducing the chance of a Type II error.
Total: 4–6 marks.
