
AP Syllabus focus:
‘Check for independence by ensuring the two samples are independent of each other, such as by using random sampling or randomized experiments.
- When sampling without replacement, ensure that the sample sizes are less than 10% of their respective populations (n1/N1 ≤ 10% and n2/N2 ≤ 10%).
- For normality, each product of sample size and sample proportion (n1p̂1, n1(1-p̂1), n2p̂2, and n2(1-p̂2)) should be greater than or equal to a minimum value, typically 5 or 10, to suggest the sampling distribution is approximately normal.’
Verifying conditions ensures that a two-sample z-interval for a difference of population proportions is statistically valid, allowing reliable inferences based on well-behaved sampling distributions.
Verifying Conditions for Confidence Intervals
Before constructing a confidence interval for the difference between two population proportions, students must confirm that specific assumptions are met. These checks protect against misleading results and ensure that the sampling distribution of the difference in sample proportions behaves approximately normally. AP Statistics emphasizes three central considerations: independence of samples, independence within each sample, and adequate sample size for normality. Each condition aligns with the goal of producing stable, interpretable estimates of population parameters.
Independence of the Two Samples
A confidence interval for a difference in proportions requires that the groups being compared are independent. Independence ensures that outcomes from one sample do not influence outcomes in the other.
Independence of Samples: Two samples are independent when the selection or outcomes of individuals in one group have no effect on those in the other group.
To satisfy this condition, the study must use random sampling or a randomized experiment.
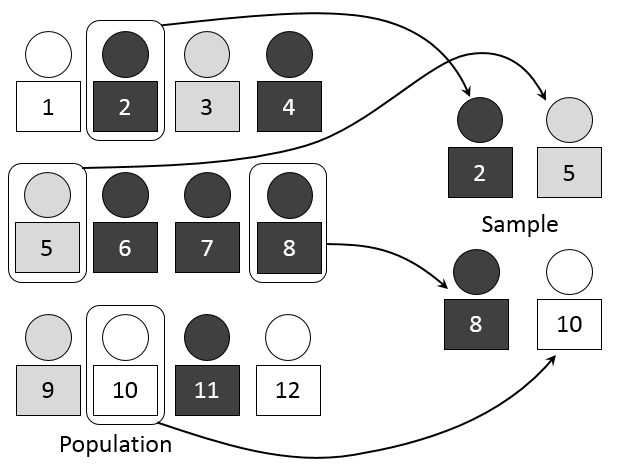
This diagram illustrates the process of taking a simple random sample from a larger population. Every individual has an equal chance of being selected, supporting the independence assumption. Although it does not explicitly show the 10% cutoff, it clearly visualizes a sample drawn from a much larger population. Source.
When the two groups come from distinct populations or are assigned through random assignment, the independence condition is typically met. Researchers must avoid using overlapping or repeated individuals across the two samples, which introduces dependence and invalidates procedures.
A normal sentence is placed here to maintain required spacing before the next definition or equation block.
Independence Within Each Sample
Even if the two samples are independent of one another, each sample must also contain observations that behave independently within the group. When sampling is conducted without replacement, individual observations become dependent unless the sample is small relative to the population. AP Statistics uses the 10% condition to justify treating observations as independent.
10% Condition: A guideline stating that when sampling without replacement, the sample size must be no more than 10% of the population to treat observations as independent.
To apply this check, confirm that n1/N1 ≤ 0.10 and n2/N2 ≤ 0.10. This condition prevents excessive overlap between sample members and their population, maintaining approximate independence and reducing bias that would otherwise distort interval estimates.
A normal sentence appears here to separate the definition block from upcoming mathematical requirements.
Adequate Sample Size for Normality
The sampling distribution of the difference in sample proportions should be approximately normal to justify the use of the two-sample z-interval. Normality is not assumed automatically; instead, it is supported when both samples have a sufficient number of expected successes and failures. AP Statistics uses a guideline requiring each of the following quantities to meet or exceed a threshold value, typically 5 or 10:
n1p̂1 (expected successes in sample 1)
n1(1 - p̂1) (expected failures in sample 1)
n2p̂2 (expected successes in sample 2)
n2(1 - p̂2) (expected failures in sample 2)
These values reflect whether the distribution of each sample proportion is sufficiently well-behaved to allow for a normal model.
EQUATION
Normality Check: nᵢp̂ᵢ ≥ k and nᵢ(1 − p̂ᵢ) ≥ k
nᵢ = Sample size for group i
p̂ᵢ = Sample proportion for group i
k = Threshold value (commonly 5 or 10)
Even when random sampling is present, inadequate counts of successes or failures can lead to heavily skewed sampling distributions that invalidate confidence interval procedures. Ensuring sufficiently large sample sizes allows the Central Limit Theorem–based approximations to function effectively, producing intervals that reflect true sampling variability.
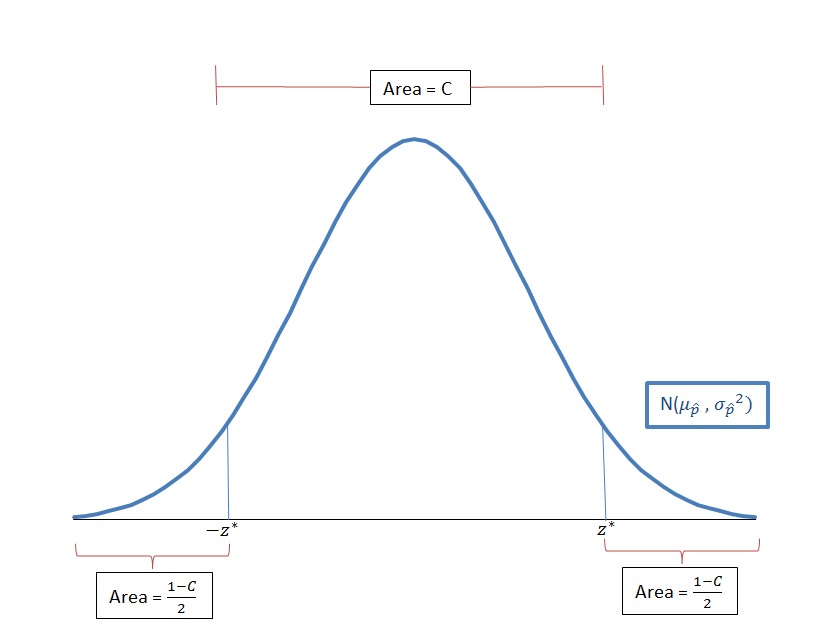
This graph shows a bell-shaped sampling distribution of sample proportions, illustrating the normal model used for z-based confidence intervals. When expected counts are sufficiently large, the distribution becomes approximately normal. Although displayed for a single proportion, the concept applies similarly to the distribution of the difference between two sample proportions. Source.
Coordinating All Conditions
A valid two-sample z-interval requires all three conditions—independence between samples, independence within samples, and adequate sample size—working together. These checks guard against bias, dependence, and non-normal sampling distributions, any of which could undermine the reliability of the resulting interval. By systematically verifying each assumption, students ensure that their confidence interval for the difference of population proportions is both meaningful and statistically justified.
FAQ
When individuals are sampled without replacement, selecting one person affects the probability of selecting others, creating dependence within the sample.
The 10% threshold ensures that this dependence is so small that it does not meaningfully distort the sampling distribution.
For very large populations, any single removal has almost no effect, making the condition automatically satisfied even for moderately sized samples.
Independence can fail when the same individuals appear in both groups, or when the two groups share an underlying structure that links their responses.
For example:
• Using two samples drawn from the same class, workplace, or household group
• When participants influence one another’s responses across groups
Such overlap can artificially inflate or reduce observed differences in sample proportions.
Normality of the sampling distribution requires each sample proportion to behave predictably. A single under-sized sample can distort the distribution of the difference, even if the other sample meets conditions.
Checking each sample separately ensures that neither contributes excessive skew, instability, or variance inflation that would undermine the z-interval.
If one sample violates the threshold for expected counts, the combined distribution of the difference is unlikely to be approximately normal.
Consequences may include:
• A poorly centred interval
• Underestimated or overestimated variability
• Confidence intervals that are too narrow or too wide
In such cases, a two-sample z-interval should not be used.
Extreme sample proportions often result in very small expected counts, even when sample sizes are large.
When this happens, the sampling distribution becomes heavily skewed, and the normal approximation breaks down.
Alternative approaches, such as exact methods or adjusted intervals, may be required, but these fall outside the scope of this subsubtopic.
Practice Questions
Question 1 (1–3 marks)
A researcher takes two independent random samples to compare the proportion of customers satisfied with a new service in City A and City B. Before constructing a confidence interval for the difference in population proportions, what condition must be checked to justify treating each sample as independent when sampling without replacement? Briefly explain why this condition is necessary.
Question 1 (1–3 marks)
• 1 mark: States the 10% condition (sample size must be no more than 10% of the population).
• 1 mark: Explains that this ensures observations within each sample can be treated as independent.
• 1 mark: Mentions that without this condition, sampling without replacement creates dependence that invalidates inference.
Question 2 (4–6 marks)
A school is comparing the proportion of students who prefer online learning between two year groups. A random sample of 120 Year 10 students includes 54 who prefer online learning. A separate random sample of 150 Year 11 students includes 90 who prefer online learning.
Before constructing a confidence interval for the difference in population proportions, verify whether the normality conditions for both samples are satisfied. Show the checks clearly.
Then explain why verifying these conditions is required for the two-sample z-interval to be valid.
Question 2 (4–6 marks)
• 1 mark: Calculates or states the expected successes and failures for Year 10 (54 successes, 66 failures) and notes both are at least 10.
• 1 mark: Calculates or states the expected successes and failures for Year 11 (90 successes, 60 failures) and notes both are at least 10.
• 1 mark: Clearly states that both samples satisfy the normality condition.
• 1 mark: Explains that these checks ensure the sampling distribution of each sample proportion is approximately normal.
• 1 mark: Notes that a normal sampling distribution is required for the two-sample z-interval to produce valid results.
• 1 mark: Provides clear reasoning linking the conditions to the reliability of the confidence interval.
