
AP Syllabus focus:
‘For two-sample comparison of proportions, use a two-sample z-interval for the difference between population proportions. This involves understanding that the confidence interval captures the possible values for the true difference between two population proportions.’
This subsubtopic introduces how to identify and justify the two-sample z-interval for the difference between population proportions, emphasizing when and why this procedure is appropriate for inference.
Understanding When to Use a Two-Sample Z-Interval
A two-sample z-interval for the difference between population proportions is the appropriate confidence interval procedure when the goal is to estimate the true difference between two population proportions using data from two independent samples. This method relies on the approximate normality of the sampling distribution of the difference in sample proportions. It is used only when each sample produces a proportion based on categorically measured outcomes.
Why Compare Two Population Proportions?
When evaluating differences between groups—such as treatment vs. control, or demographic groups—researchers often measure categorical outcomes. The parameter of interest is the difference in population proportions, written as . Identifying the correct interval procedure ensures that the resulting estimate properly reflects sampling variability and supports valid statistical interpretation.
Key Components of the Two-Sample Z-Interval
The two-sample z-interval uses paired sample information to produce an interval estimate of the likely range of . The sampling distribution for the difference in sample proportions, , becomes approximately normal under appropriate conditions related to independence and sample size.
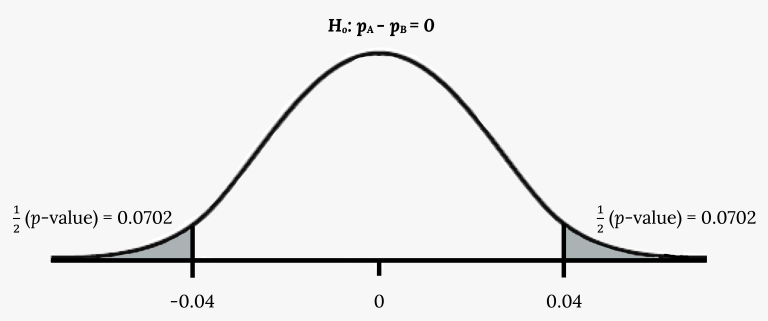
This figure displays the normal distribution for the difference in sample proportions under the null hypothesis, illustrating how the sampling distribution of is modeled. Although shading relates to p-value regions, which exceeds this subsubtopic’s scope, the core visual emphasizes the approximate normality needed for applying a two-sample z-interval. Source.
The Point Estimate
The primary statistic calculated from the sample data is the difference in sample proportions, . This value represents the observed difference and serves as the center of the confidence interval.
Point Estimate: A single statistic calculated from sample data used to estimate an unknown population parameter.
Selecting an appropriate point estimate is essential because the confidence interval builds around it to reflect potential sampling error.
Requirements for Using the Procedure
Before applying the two-sample z-interval, students must verify that the study design and data behavior justify its use. Independence and sample size adequacy are central requirements.
Independence Between and Within Samples
The samples must come from independent groups. No individual may belong to both samples, and the data-generating process must avoid any structural linkage between the groups. Random sampling or random assignment helps ensure independence.
Sufficient Sample Size for Normality
Approximate normality of the sampling distribution is necessary to use the z-based interval. This requires that both samples have sufficiently large counts of successes and failures.
Approximate Normality Condition: A requirement that expected counts of successes and failures in each sample are large enough for the sampling distribution of a statistic to be modeled by a normal distribution.
This condition ensures that the z-interval yields accurate and reliable inference.
Structure of the Confidence Interval
The two-sample z-interval has a general structure that follows the form:
point estimate ± margin of error.
The margin of error reflects uncertainty arising from sampling variability.
EQUATION
= Sample proportions representing each group
= Sample sizes for the two groups
= Critical value associated with the chosen confidence level
This structure reinforces that the interval captures plausible values of the true difference between population proportions based on observed data.
A confidence interval based on this formula will widen or narrow depending on sample sizes, variability within each sample, and the selected confidence level.
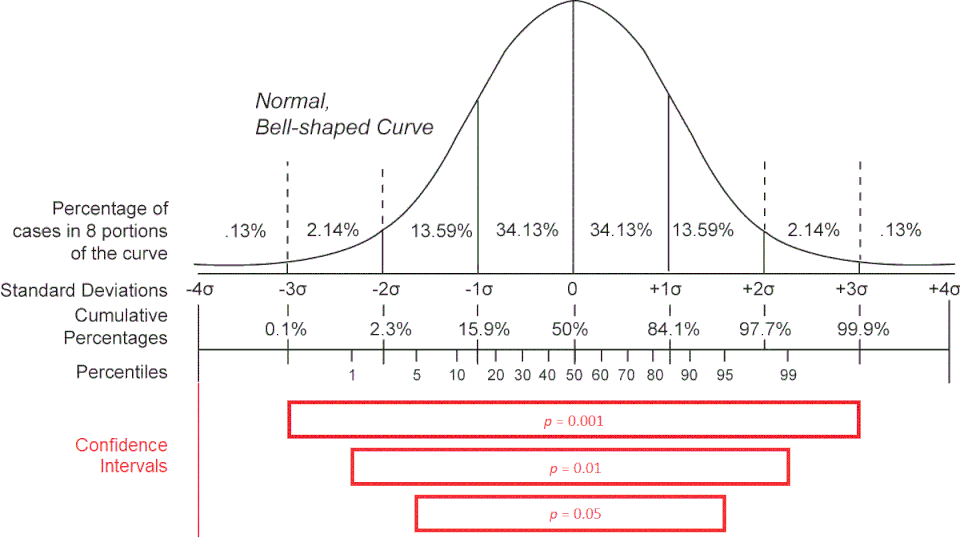
This diagram displays several confidence intervals of different confidence levels drawn on a normal curve. Higher confidence levels require wider intervals, visually connecting confidence level to interval width. Although the figure represents a generic normal distribution, the same conceptual structure underlies z-based confidence intervals for proportions and for the difference between two proportions. Source.
When the Two-Sample Z-Interval Is the Correct Choice
Choosing the correct interval procedure requires assessing the statistical goal, the nature of the data, and the study design. The two-sample z-interval is appropriate under the following circumstances:
The research question focuses on estimating the difference between two population proportions, .
The data for each group consist of categorical outcomes classified into two categories (success/failure).
The two samples are independent, generated through random sampling or random assignment.
Success–failure conditions for each sample indicate that normal approximation is reasonable.
The study does not involve matched pairs or dependent samples, which require different methods.
Interpreting the Purpose of the Interval
The goal of this procedure is not to test a hypothesis but to estimate a range of plausible values for the difference in population proportions. This range communicates uncertainty and supports claims about whether meaningful differences between groups may exist. The interval reflects natural sample-to-sample variability and helps quantify the degree of confidence in the estimation process.
FAQ
A single two-sample z-interval accounts for the joint variability of both sample proportions in one calculation, producing an interval with the correct overall error rate.
Constructing two separate one-sample intervals and subtracting their endpoints ignores the combined sampling variability and results in an interval that is generally too wide and does not correspond to a valid confidence level.
Independence ensures that variation in one sample does not influence the variation in the other. Without this, the standard error formula would underestimate or overestimate true variability.
If samples are dependent, additional modelling or paired approaches are required, since the dependence structure affects the distribution of the difference in sample proportions.
Unequal sample sizes are permitted, but the smaller sample controls whether the normal approximation is reasonable.
If one sample is much smaller, the combined variability may increase and the resulting interval may be wider. Large imbalance can also make the success–failure condition fail in the smaller group.
No. The interval remains valid even when the two population proportions differ substantially, provided the conditions for independence and adequate sample sizes are met.
Very extreme sample proportions (close to 0 or 1) may reduce normality, but this issue relates to sample conditions, not the true population values.
Pooling is used in hypothesis testing when assuming the two population proportions are equal under the null hypothesis.
For interval estimation, no such assumption is made. Each sample’s proportion reflects its own group’s behaviour, so pooling would distort the variability estimate and bias the width of the confidence interval.
Practice Questions
Question 2 (4–6 marks)
A school is evaluating participation in two extracurricular clubs: Science Club and Arts Club. From a random sample of 120 Science Club students, 78 report attending weekly meetings. From an independent random sample of 95 Arts Club students, 47 report attending weekly meetings.
The school wishes to estimate the true difference in the population proportions of weekly attendance (Science Club proportion minus Arts Club proportion).
(a) Identify the appropriate confidence interval procedure for this scenario and justify your choice.
(b) State the conditions required for using this procedure and comment on whether they are satisfied.
(c) Explain, without calculating, how the margin of error would be affected if the school doubled both sample sizes.
Question 2 (4–6 marks)
(a) (1–2 marks)
• 1 mark for correctly identifying the procedure as a two-sample z-interval for the difference between population proportions.
• 1 mark for justification, such as recognising that the outcome is categorical and two independent samples are being compared.
(b) (2–3 marks)
• 1 mark for stating the independence requirement (random sampling or random assignment, and samples that do not influence each other).
• 1 mark for stating the sample size/normality requirement (each group must have sufficiently large counts of successes and failures).
• 1 mark for commenting correctly that both samples meet these criteria based on the given counts.
(c) (1 mark)
• 1 mark for explaining that doubling both sample sizes would reduce the margin of error because the standard error becomes smaller as sample size increases.
Question 1 (1–3 marks)
A researcher collects two independent random samples to compare the proportion of customers who prefer Brand A in two different cities. She wishes to estimate the difference between the population proportions.
Explain why a two-sample z-interval for the difference in population proportions is the appropriate procedure to use in this context.
Question 1 (1–3 marks)
• 1 mark for stating that the parameter of interest is the difference between two population proportions.
• 1 mark for noting that the data come from two independent samples.
• 1 mark for stating that a two-sample z-interval is appropriate because proportions are being compared and the method estimates the possible values of the true difference.
