
AP Syllabus focus:
‘Interpret the p-value of the test as the probability of obtaining a test statistic as extreme as, or more extreme than, the calculated t-statistic under the assumption that the null hypothesis is true.
- Recognize that a small p-value indicates that the observed data are unlikely under the null hypothesis and may suggest rejecting the null hypothesis in favor of the alternative.’
AP Statistics significance tests rely on understanding how unusual sample results would be if the null hypothesis were true, making the interpretation of the p-value essential for inference.
Interpreting the p-Value
A p-value is central to decision-making in hypothesis testing because it quantifies how compatible the sample data are with the null hypothesis. Students must understand that the p-value links sample outcomes to probability statements under the assumption that the null hypothesis is true, allowing researchers to evaluate whether observed evidence meaningfully contradicts the null model.
What the p-Value Represents
The p-value measures the probability of obtaining a test statistic as extreme as or more extreme than the calculated value assuming the null hypothesis is true.
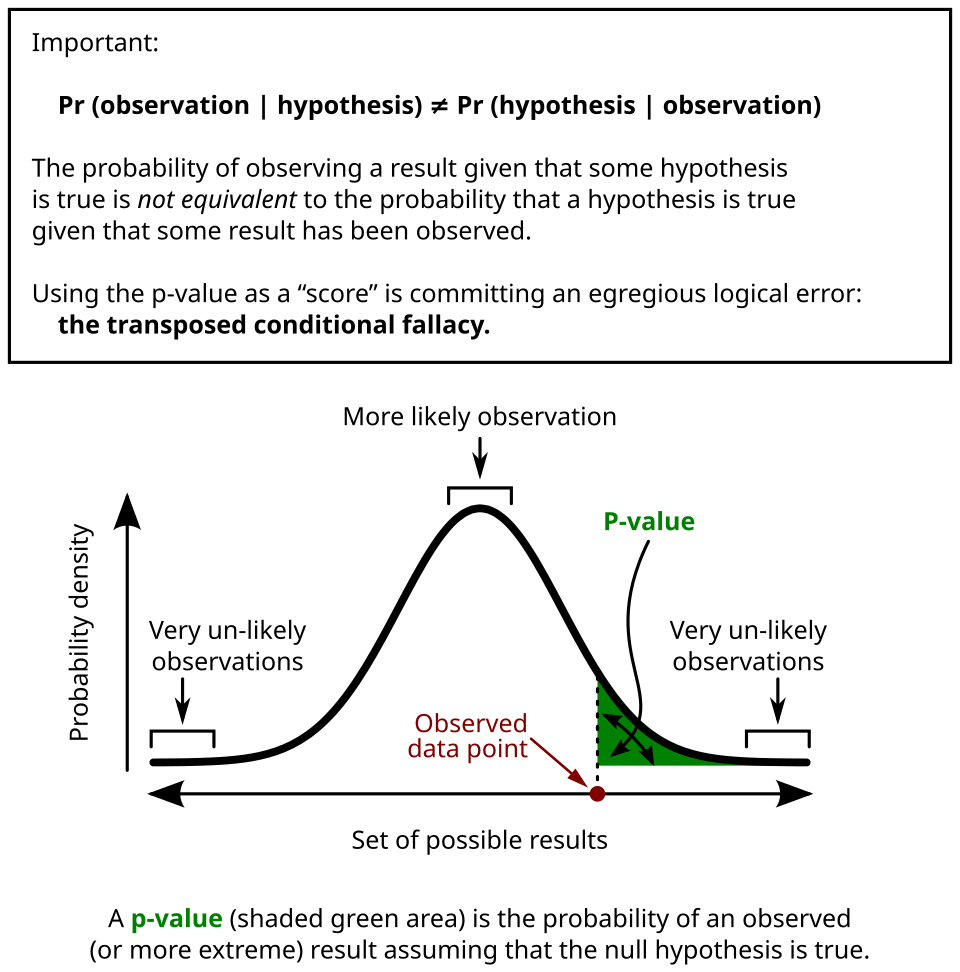
Illustration of a p-value as the shaded tail area under a sampling distribution, showing outcomes at least as extreme as the observed statistic under the null hypothesis. The image includes additional notation not required by the syllabus but remains conceptually aligned. Source.
This aligns exactly with the syllabus requirement that students interpret the p-value in relation to the extremeness of the observed t-statistic. Because the interpretation depends on a hypothetical world where the null hypothesis holds, a p-value is not the probability that the null is true, nor the probability that results are due to chance.
p-value: The probability, computed under the assumption that the null hypothesis is true, of observing a test statistic as extreme as or more extreme than the value found in the sample.
A crucial aspect of interpreting p-values is recognizing the role of extremeness, which depends on whether the alternative hypothesis is one-sided or two-sided. A two-sided test considers extremeness in both directions from the hypothesized mean, while a one-sided test considers only the direction specified.
Why Small p-Values Matter
According to the specification, a small p-value indicates that the observed data are unlikely under the null hypothesis, potentially leading to rejection of the null in favor of the alternative. A small p-value signals that the sample mean is far enough from the hypothesized mean, relative to variability, that the null model struggles to plausibly explain the observation.
Key ideas emphasized in AP Statistics include:
A small p-value means the sample outcome is surprising under the null.
A large p-value means the sample outcome is consistent with what would be expected if the null were true.
The threshold for “small” is the significance level, α, chosen before analyzing data.
Connecting the p-Value to the Test Statistic
In tests for a population mean when the population standard deviation is unknown, the test statistic follows a t-distribution with degrees of freedom.
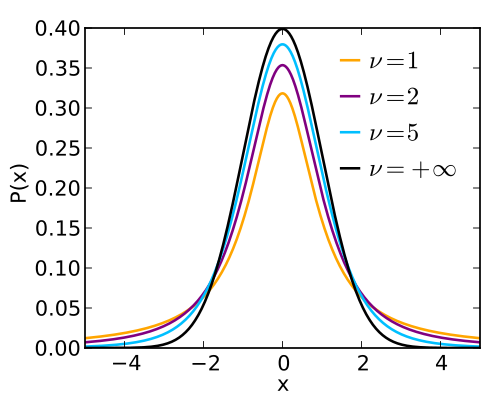
Multiple t-distributions with varying degrees of freedom illustrate how the sampling distribution of the t-statistic changes with sample size, approaching the normal curve as degrees of freedom increase. Extra comparisons included exceed the minimum syllabus requirement but reinforce conceptual understanding. Source.
Students should understand how the extremeness of the t-statistic influences the p-value: more extreme test statistics yield smaller p-values.
EQUATION
= Sample mean
= Hypothesized population mean
= Sample standard deviation
= Sample size
Once the t-statistic is computed, the p-value is determined using the appropriate tail(s) of the t-distribution, depending on the structure of the alternative hypothesis.
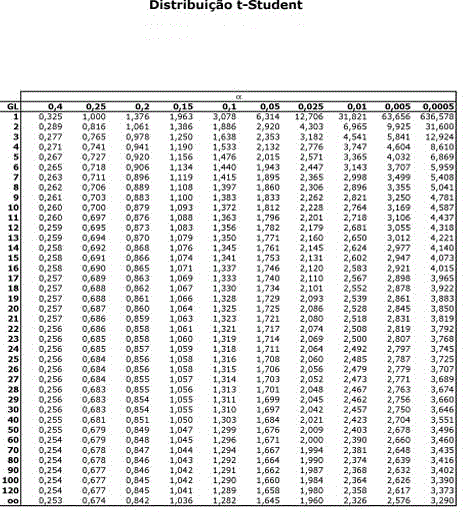
The shaded region represents the p-value under the t-distribution, showing probability in the relevant tail beyond the observed test statistic. Labels are in Portuguese but correspond directly to standard English statistical terminology. Source.
Understanding these relationships helps students interpret p-values not as abstract probabilities but as outcomes tied directly to the sampling distribution of the test statistic.
Interpreting p-Values in Context
Contextual reasoning is a required skill. When interpreting a p-value, students must refer to:
The parameter being tested (population mean).
The direction or nature of the alternative hypothesis.
The study context, ensuring statements accurately describe the population of interest.
A correct interpretation should always be conditional on the assumption that the null hypothesis is true. It must not imply that the p-value represents the probability that the null is true, the probability that results were due to random chance alone, or the probability that the alternative is correct. Instead, the p-value reflects how consistent the sample evidence is with the null model.
Decision-Making and the p-Value
Although this subsubtopic focuses on interpretation rather than formal decision rules, understanding how p-values support conclusions is essential. A small p-value suggests that the null hypothesis does not provide a reasonable explanation for the observed sample outcome. A large p-value suggests insufficient evidence to challenge the null. These interpretations must always be framed as evidence-based statements about compatibility with the null, not absolute confirmations or rejections of hypotheses.
Common Misinterpretations to Avoid
Students should be aware of frequent misconceptions, all of which contradict the AP-required interpretation:
The p-value is not the probability that the null hypothesis is true.
The p-value is not the probability the sample results were caused “by chance.”
A large p-value does not prove the null hypothesis; it only indicates lack of strong evidence against it.
A small p-value does not guarantee a meaningful or practically important effect; it only addresses statistical evidence.
Recognizing these pitfalls supports clearer, more accurate communication of inferential results, which is essential in AP Statistics.
FAQ
A one-sided alternative hypothesis uses only one tail of the sampling distribution, so the p-value reflects the probability of observing a statistic as extreme in that specific direction.
A two-sided hypothesis splits extremeness across both tails. The p-value therefore combines the probability of results at least as extreme in either direction.
This means two-sided tests typically produce larger p-values than one-sided tests for the same test statistic.
A very large sample can make even tiny departures from the null hypothesis statistically detectable.
This happens because the test statistic grows with increased precision of the estimate.
Small p-values therefore do not necessarily imply a meaningful or practically important effect; they only reflect incompatibility with the null model.
P-values tend to be more stable when:
• The sample size is large.
• The population distribution is close to normal.
• The variability in the data is low.
In contrast, small samples or highly variable data produce greater fluctuation in test statistics and therefore p-values across repeated sampling.
A large p-value indicates that the observed data are compatible with the null hypothesis, but it does not prove the null true.
Large p-values may arise simply because the sample is too small to detect a meaningful difference.
Thus, the result reflects insufficient evidence against the null, not positive evidence supporting it.
Rounding the test statistic can slightly alter the p-value, especially when the value lies near a critical boundary.
When using tables, rounding can reduce precision because tables give only approximate tail probabilities.
Software typically avoids this issue by computing p-values with many decimal places, but students should still report values to a reasonable number of significant figures.
Practice Questions
Question 1 (1–3 marks)
A researcher tests the claim that the mean reaction time of drivers is 0.75 seconds. A one-sample t-test produces a p-value of 0.028.
(a) Under the assumption that the null hypothesis is true, explain what this p-value represents.
(b) At the 5% significance level, state whether the result provides evidence against the null hypothesis and justify your decision.
Question 1
(a) 1–2 marks
• 1 mark: States that the p-value is the probability of obtaining a test statistic as or more extreme than the observed value if the null hypothesis is true.
• 1 mark: Includes reference to “under the assumption that the null hypothesis is true” and mentions extremeness or unusualness of the data.
(b) 1 mark
• Correctly states that at the 5% level, the null hypothesis should be rejected because 0.028 is less than 0.05.
Total: 3 marks
Question 2 (4–6 marks)
A sleep study investigates whether the mean number of hours slept per night differs from the recommended 8 hours. From a random sample of 40 adults, the researcher conducts a one-sample t-test and obtains a t-statistic of 2.31 with a two-sided p-value of 0.026.
(a) Interpret the p-value in the context of the study.
(b) Based on this p-value, discuss whether the sample provides convincing statistical evidence that the population mean differs from 8 hours.
(c) Identify one common misinterpretation of a p-value and explain why it is incorrect.
Question 2
(a) 1–2 marks
• 1 mark: States that the p-value is the probability of observing a test statistic at least as extreme as the sample's t-statistic under the assumption that the null hypothesis is true.
• 1 mark: Interpretation is contextualised, referring to mean sleep hours or deviation from 8 hours.
(b) 1–2 marks
• 1 mark: States that the evidence suggests the population mean differs from 8 hours because the p-value is lower than a typical significance level (e.g., 5%).
• 1 mark: Explanation shows understanding that small p-values indicate inconsistency between the observed data and the null hypothesis.
(c) 1–2 marks
• 1 mark: Identifies a valid misconception, such as “the p-value is the probability that the null hypothesis is true”.
• 1 mark: Explains why this interpretation is wrong, noting that the p-value is conditional on the null hypothesis being assumed true.
Total: 6 marks
