
AP Syllabus focus:
‘Use the results of the significance test to support or refute a claim about the population mean. A rejected null hypothesis provides evidence for the alternative hypothesis and may justify a claim that the population mean differs from the hypothesized value μ0. A failure to reject the null hypothesis suggests that there is not sufficient evidence to support a claim of a difference from μ0. Explain the implications of the test outcome in the context of the research question and the statistical reasoning involved.’
Understanding how to justify claims using significance test results is essential for interpreting statistical evidence and connecting numerical outcomes to meaningful conclusions about population parameters in context.
Using Test Results to Justify Claims
When conducting a one-sample t-test for a population mean, statisticians must translate numerical evidence into statements that address the original research question. This requires careful interpretation of the test outcome, focusing on whether the evidence supports or fails to support a claim about the population mean. Because sample data involve random variation, the justification of claims depends on comparing the p-value to a preselected significance level and evaluating what the result suggests about the underlying population parameter.
Understanding Claims in the Context of Hypotheses
Claims are tied to the null hypothesis and alternative hypothesis, which reflect competing statements about the population mean. The claim being evaluated may align with either hypothesis, but justification always relies on evidence from the collected sample.
Null Hypothesis (H₀): The statement that the population mean equals the hypothesized value , representing no difference or no effect.
A brief interval of logical reasoning separates hypotheses from conclusions. A statistical test does not prove a hypothesis true or false; instead, it evaluates whether the sample provides strong enough evidence to question the assumption made in the null hypothesis.
Alternative Hypothesis (Hₐ): The statement that the population mean differs from the hypothesized value , indicating a possible effect or change.
To justify a claim, the analyst must determine whether the test outcome supports the view expressed in the alternative hypothesis or maintains the position of the null hypothesis.
Role of the p-Value in Justifying Claims
The p-value serves as the key piece of evidence in a significance test. It quantifies how surprising the observed sample result would be if the null hypothesis were true. Lower values indicate stronger inconsistency with the null hypothesis and greater support for the alternative.
p-Value: The probability, assuming the null hypothesis is true, of obtaining a test statistic as extreme as or more extreme than the observed value.
A meaningful justification requires clearly comparing the p-value to the significance level α. This threshold represents the maximum acceptable probability of mistakenly rejecting a true null hypothesis. Thus, decision-making and justification must always occur within this predetermined framework.
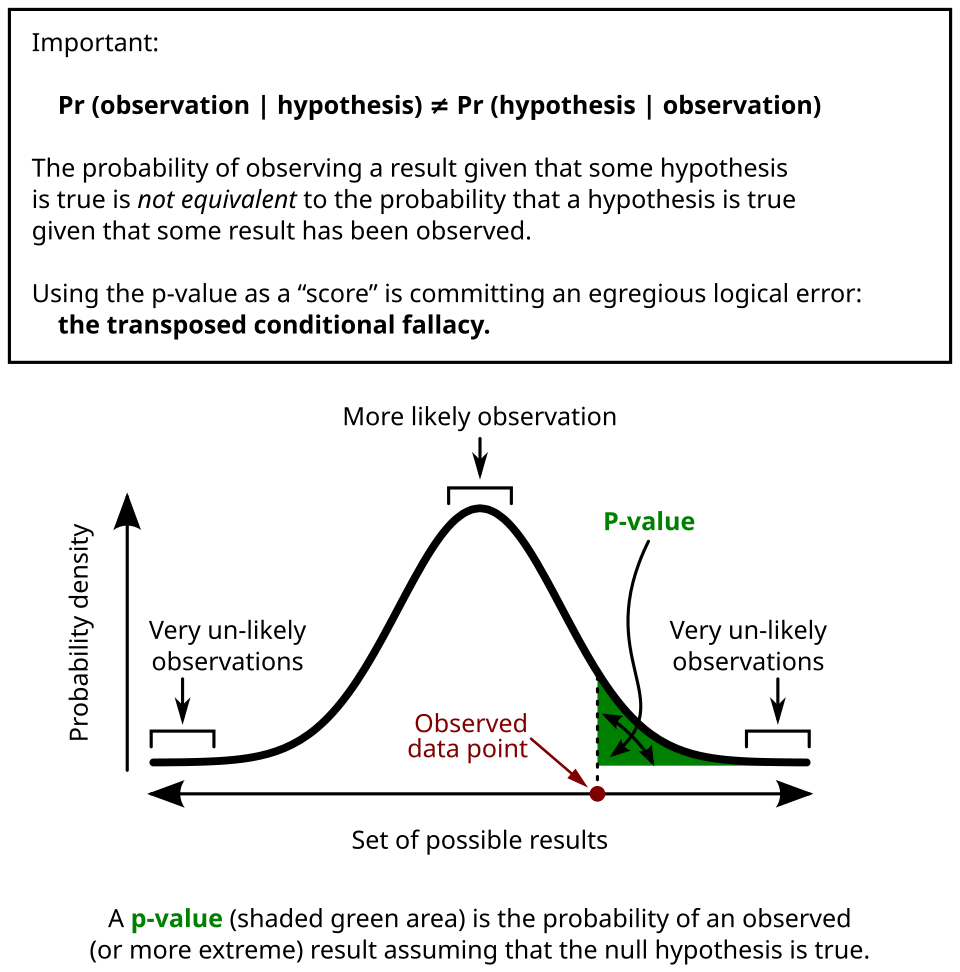
This diagram shows a null distribution with the p-value shaded in the tail, illustrating how unlikely results under the null hypothesis provide evidence supporting the alternative. The shaded tail highlights why small p-values justify rejecting H0H_0H0. All visible text directly aligns with AP Statistics treatment of p-values. Source.
Making and Justifying Decisions Based on Test Outcomes
When interpreting test results, the reasoning must follow established statistical rules while remaining tied to the specific context of the data.
When the Null Hypothesis Is Rejected
If p ≤ α, the test supplies evidence that the sample mean differs from the hypothesized value. This does not prove the alternative hypothesis but indicates that the data are unlikely under the null model.
Key reasoning points include:
The evidence is sufficient to support a claim that the population mean differs from .
The conclusion must explicitly reference the direction of the alternative hypothesis when relevant.
The justification must be stated in real-world terms rather than purely statistical phrasing.
When the Null Hypothesis Is Not Rejected
If p > α, the data are not surprising under the null hypothesis. Consequently, the test does not offer enough evidence to support a claim of difference.
Important considerations include:
Failure to reject does not prove the null hypothesis true; it simply reflects insufficient evidence.
Claims asserting a difference cannot be justified because the data do not strongly contradict .
The interpretation must emphasize that conclusions are about evidence, not absolute truth.
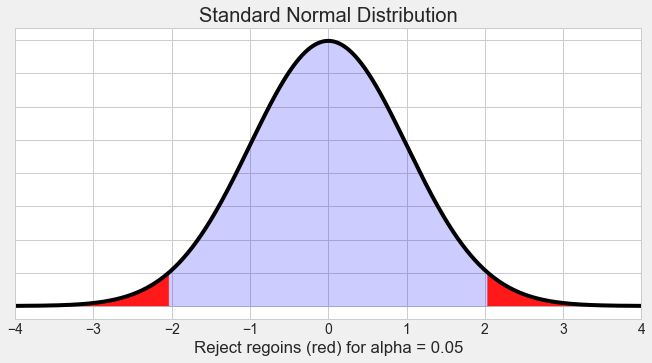
This figure illustrates a rejection region determined by the significance level, showing how a test statistic falling within the shaded tail leads to rejecting H0H_0H0. Although drawn for a z-test, the conceptual decision rule is identical for t-tests used in AP Statistics. Source.
Connecting Statistical Evidence to Claims in Context
Justification is strongest when tied clearly to the scenario being studied. Contextualization shows how the statistical result informs real-world interpretation. Effective contextual statements should:
Refer directly to the population and parameter of interest.
Use phrases such as “the results provide evidence that…” when rejecting H₀.
Use phrases such as “there is not enough evidence to conclude that…” when failing to reject H₀.
Emphasize that conclusions depend on sample-based uncertainty and the methodology of the significance test.
Because statistical reasoning must account for inherent variability, clear and accurate communication ensures that claims are neither overstated nor misinterpreted.
Implications of the Test Outcome
The implications of a significance test extend beyond the numerical decision. Analysts must consider:
The strength of evidence, as indicated by the magnitude of the p-value.
The practical meaning of any detected difference, even if statistically significant.
Whether additional data or more precise measurement may be necessary before making strong claims.
These implications help guide responsible interpretation, ensuring that claims remain rooted in the evidence produced by the sample and the assumptions underlying the significance test.
FAQ
Evidence is considered strong enough when the p-value is small enough to make the observed result genuinely surprising under the null hypothesis. However, what counts as “strong” depends on the chosen significance level and the context of the claim.
In some real research settings, more stringent thresholds (such as 0.01) are used when the consequences of an incorrect claim are serious. AP Statistics focuses on interpreting evidence relative to the chosen alpha, but students should recognise that justification is a contextual judgment, not merely a mechanical rule.
Failing to reject the null hypothesis means the data are not inconsistent with it, not that the null hypothesis has been proven.
This is because tests are designed only to detect evidence against the null, not to verify it.
• A lack of evidence against H0 could arise from a small sample, high variability, or limited test sensitivity.
• Therefore, justification must focus on insufficient evidence rather than confirmation.
Larger samples reduce variability in the test statistic, making evidence more reliable.
Two studies could produce p-values on opposite sides of the significance threshold, but a result based on a larger sample generally offers more credible justification.
• Bigger samples reduce the likelihood that significant results arise from random noise.
• Conversely, small samples may produce borderline p-values that warrant cautious interpretation.
Yes, in practice a claim may be described as having weak or tentative support when the p-value is near alpha, although AP scoring focuses on clear decision rules.
A near-threshold p-value suggests the sample provides some evidence against H0 but not enough for formal rejection.
Students should recognise that:
• Evidence exists on a continuum.
• Close p-values warrant cautious wording to avoid overstating the certainty of the claim.
A statistically significant result does not necessarily justify a meaningful real-world claim.
A tiny difference in the population mean may be statistically detectable with a large sample but too small to matter in practice.
When justifying claims, consider:
• The magnitude of the estimated difference.
• Whether the difference affects decisions, processes, or outcomes in the real context.
• Whether further investigation is needed before drawing applied conclusions.
Practice Questions
Question 1 (1–3 marks)
A researcher conducts a one-sample t-test to investigate whether the mean caffeine consumption of sixth-form students differs from 180 mg per day. The test produces a p-value of 0.012 using a significance level of 0.05.
(a) What decision should the researcher make regarding the null hypothesis?
(b) Briefly justify whether a claim that the population mean differs from 180 mg per day is supported.
Question 1
(a) 1 mark
• Reject the null hypothesis. (1)
(b) 1–2 marks
• States that the claim is supported because the p-value is less than the significance level. (1)
• Explains that this provides sufficient evidence that the population mean differs from 180 mg per day. (1)
Total: 2–3 marks
Question 2 (4–6 marks)
A charity claims that the average time volunteers spend per week on outreach activities is greater than 6 hours. A random sample of 40 volunteers is taken, and a one-sample t-test is carried out with the null hypothesis H0: mean = 6 and alternative hypothesis Ha: mean > 6. The resulting p-value is 0.18 at a significance level of 0.05.
(a) State the correct decision regarding the null hypothesis.
(b) Explain whether the charity’s claim is justified based on the test results.
(c) In context, explain what the p-value represents and why it does or does not provide evidence for the claim.
Question 2
(a) 1 mark
• Fail to reject the null hypothesis. (1)
(b) 1–2 marks
• States that the charity’s claim is not justified. (1)
• Explains that the evidence is insufficient because the p-value is greater than the significance level. (1)
(c) 2–3 marks
• Defines the p-value in context: the probability of obtaining a test result as extreme as the one observed if the true mean time is 6 hours. (1)
• States that a large p-value indicates the data are consistent with the null hypothesis. (1)
• Explains that therefore the sample does not provide evidence that volunteers spend more than 6 hours per week on outreach. (1)
Total: 4–6 marks
