
AP Syllabus focus:
‘Compare the p-value to the pre-determined significance level (α). If the p-value is less than or equal to α, reject the null hypothesis, which states that the population mean is equal to μ0. If the p-value is greater than α, fail to reject the null hypothesis, indicating that there is not enough evidence to support the alternative hypothesis. Always present the decision within the context of the research question and the data collected.’
This subsubtopic explains how statisticians turn numerical results from a t-test into formal, contextual decisions about hypotheses by comparing the p-value to a chosen significance level.
Making Decisions in Hypothesis Testing
When performing a one-sample t-test, the final step is to decide whether the sample data provide convincing evidence against the null hypothesis. This decision is based entirely on the comparison between the p-value and the predetermined significance level (α, the probability of a Type I error). Understanding this comparison is essential because the outcome guides the statistical conclusion and the way results are communicated in context.
The Role of the Significance Level
The significance level (α) is selected before conducting the test and represents the threshold for deciding whether an observed result is statistically unlikely under the null hypothesis. Smaller values of α reflect a stricter standard for evidence, reducing the chance of a false rejection of the null hypothesis.
Significance Level (α): The pre-chosen probability of rejecting the null hypothesis when it is actually true; a threshold for determining statistical significance.
Researchers use α to quantify how much risk of error they are willing to tolerate before concluding that the sample provides strong enough evidence to challenge the null hypothesis.
Understanding the p-Value
The p-value measures how likely it is to observe a test statistic as extreme as the sample’s test statistic if the null hypothesis is true. It evaluates the compatibility between the sample data and the null model.
Image insertion point #2 occurs here ↓
The p-value measures how likely it is to observe a test statistic as extreme as the sample’s test statistic if the null hypothesis is true.
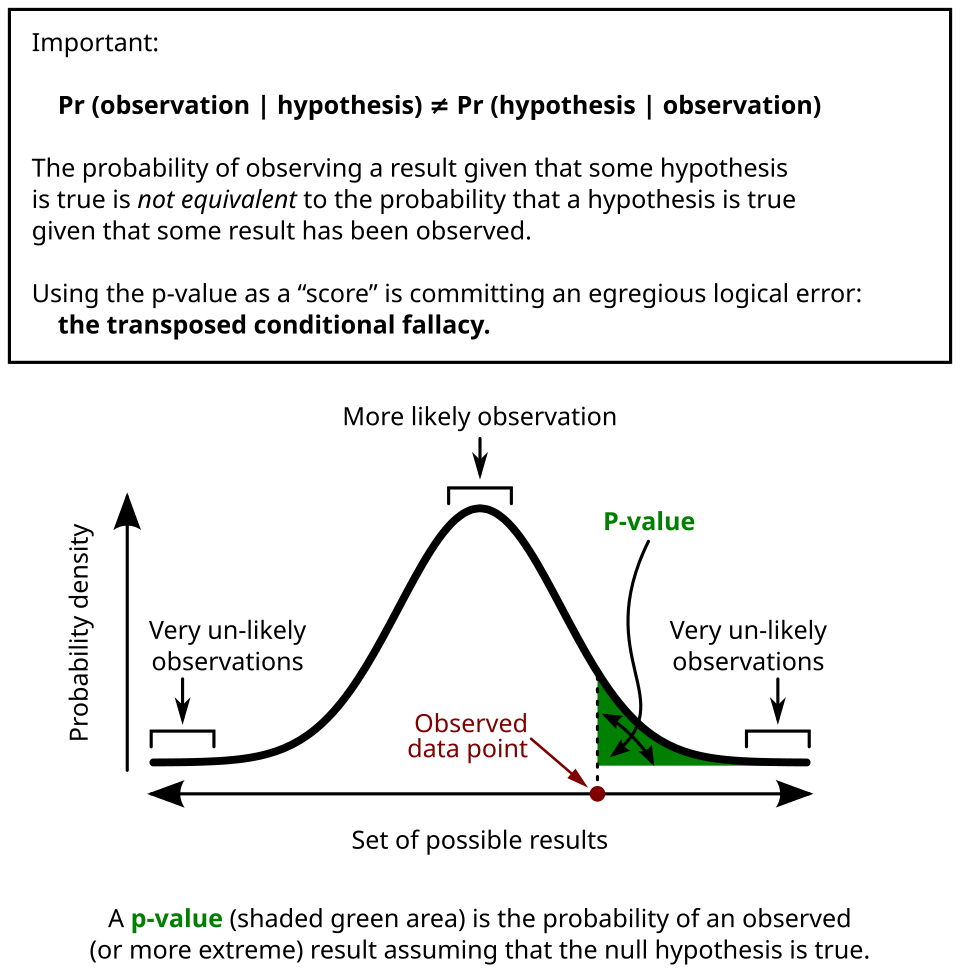
The diagram shows a distribution curve with the observed test statistic marked and the corresponding right-tail area shaded as the p-value, illustrating how extremeness under the null hypothesis is quantified. Source.
p-Value: The probability of obtaining a test statistic as extreme as, or more extreme than, the observed value under the assumption that the null hypothesis is true.
A small p-value signals that the observed data are inconsistent with what would typically be expected if the null hypothesis were true.
The Decision Rule: Comparing p-Value and α
Because the significance level sets the boundary for what counts as rare evidence under the null hypothesis, comparing the p-value to α yields a clear decision rule.
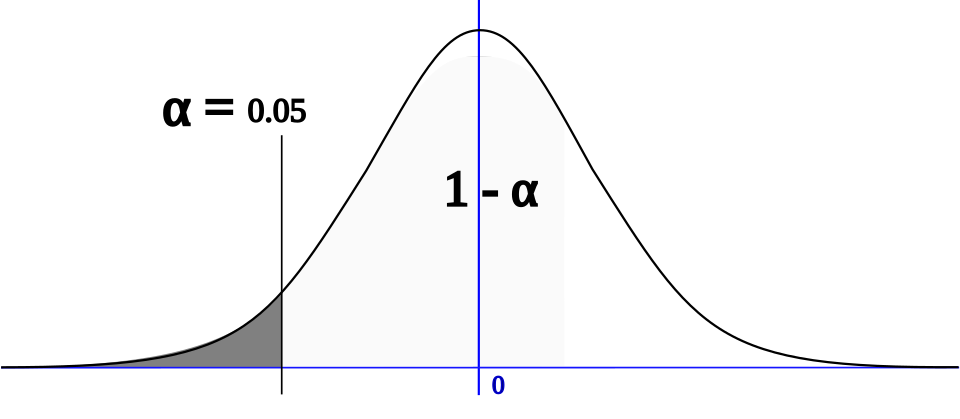
This t-distribution curve highlights the rejection region determined by the significance level α, showing where a test statistic must fall to justify rejecting the null hypothesis. Source.
This rule ensures consistency and objectivity across hypothesis-testing procedures.
Use the following decision structure:
If p-value ≤ α:
Reject H₀.
Conclude that the sample provides statistically significant evidence in favor of the alternative hypothesis.
If p-value > α:
Fail to reject H₀.
Conclude that the sample does not provide sufficient evidence to support the alternative.
This rule helps standardize statistical reasoning and links probability-based evidence to inferential conclusions.
Why “Fail to Reject” Is Not the Same as “Accept”
Failing to reject the null hypothesis does not imply proving it true. It merely indicates insufficient evidence to support the alternative. Because statistical decisions rely on sample data subject to random variation, results must be interpreted cautiously.
Fail to Reject H₀: A decision indicating that the evidence is not strong enough to conclude that the population mean differs from the hypothesized value.
A normal sentence goes here to maintain required spacing between structured blocks and preserve clarity of exposition.
Connecting Statistical Decisions to Context
The syllabus emphasizes that statistical decisions must always be framed in the context of the research question. Students must connect numerical results to meaningful, domain-specific statements.
To communicate decisions effectively:
Identify the parameter of interest (population mean).
Refer to the hypothesized value (μ₀).
State the decision using the comparison between p-value and α.
Explain what the decision means about the population in context.
For example, a formal decision should avoid unsupported claims, remain conditional on the available evidence, and explicitly reference the sample upon which the inference is based.
Consequences of the Decision Rule
Using the p-value and α ensures transparency about the risk of errors in statistical decision-making. A student must recognize that:
A smaller α makes it harder to reject the null hypothesis, reducing Type I error risk but increasing Type II error risk.
A larger p-value indicates that the data are plausible under the null hypothesis, guiding the decision to fail to reject.
A rejected null hypothesis implies statistically significant evidence of a difference in the population mean but does not alone quantify the magnitude or practical importance of that difference.
These considerations highlight why hypotheses, statistical evidence, and decisions must be integrated thoughtfully and presented with precision.
Presenting Decisions Clearly
Effective communication of test results should use concise statistical language. Key features of strong reporting include:
Stating the comparison (p-value versus α).
Reporting whether the result is statistically significant.
Connecting the conclusion to the population mean rather than the sample alone.
Emphasizing that the inference is data-based and probabilistic.
Bullet points can help structure the essential elements:
Reference to the hypotheses (H₀ and Hₐ)
Explicit statement of α
Report of the p-value
Decision (reject or fail to reject)
Contextual interpretation
This structured approach ensures the decision is transparent, defensible, and aligned with AP Statistics expectations.
FAQ
The choice of significance level depends on how costly or serious a Type I error would be in context. If rejecting a true null hypothesis could have major consequences, a smaller alpha such as 0.01 is more appropriate.
In less sensitive settings, alpha values like 0.05 or 0.10 may be acceptable. What matters is that alpha must be fixed in advance and justified in terms of the scenario, not chosen after seeing the data.
Both approaches lead to the same decision, but the p-value provides more information because it measures the strength of evidence against the null hypothesis, not just whether the result crosses a boundary.
Using the p-value also makes it easier to report results clearly and consistently, especially when communicating to non-specialists or comparing results across multiple tests.
A p-value near alpha indicates that the evidence is borderline, and small changes in the sample could shift the decision.
Instead of treating the result as absolutely significant or insignificant, it is better to interpret it as providing weak or marginal evidence and emphasise the uncertainty in your conclusion.
Larger samples produce smaller standard errors, which makes even small deviations from the hypothesised mean more detectable.
As n increases, test statistics tend to grow in magnitude for the same observed difference, often leading to smaller p-values. This means large samples can yield statistically significant results that may not be practically significant.
The null hypothesis represents a model used for comparison, not a claim of truth. Failing to reject it simply means the evidence is insufficient to show a real difference.
Accepting the null would imply proving it true, which is impossible with sample data. The correct phrasing avoids overstating the strength of the evidence and maintains the probabilistic nature of inference.
Practice Questions
A researcher conducts a one-sample t-test with significance level alpha = 0.05 and obtains a p-value of 0.18. What decision should be made regarding the null hypothesis, and why? (1–3 marks)
Question 1 (1–3 marks)
1 mark for identifying the correct decision: fail to reject the null hypothesis.
1 mark for stating that this is because the p-value (0.18) is greater than alpha (0.05).
1 mark for noting that there is not sufficient evidence to support the alternative hypothesis.
A nutritionist tests whether the mean sodium content of a brand of soup differs from the advertised value of 600 mg. A random sample of 40 cans is selected, and a one-sample t-test is performed at alpha = 0.01. The test output shows a p-value of 0.007.
(a) Based on the p-value and significance level, state the decision about the null hypothesis.
(b) Explain in context what this decision means about the sodium content of the soup.
(c) Comment on whether this decision guarantees that the true mean sodium content is different from 600 mg. (4–6 marks)
Question 2 (4–6 marks)
(a)
1 mark for stating the correct decision: reject the null hypothesis.
1 mark for justifying the decision by noting that the p-value (0.007) is less than alpha (0.01).
(b)
1 mark for interpreting the decision in context: the data provide statistically significant evidence that the mean sodium content differs from 600 mg.
1 mark for explicitly linking the conclusion to the population mean, not the sample alone.
(c)
1 mark for correctly stating that the decision does not guarantee the true mean is different from 600 mg but indicates strong evidence based on the sample.
1 mark for acknowledging the probabilistic nature of inference and the possibility of a Type I error.
