
AP Syllabus focus:
‘Null Hypothesis (H0): Specifies the expected proportions for each category in the categorical data, indicating that the observed distribution matches the expected distribution.
- Alternative Hypothesis (Ha): States that at least one category's proportion is different from what is specified in the null hypothesis, suggesting a discrepancy between the observed and expected distributions.’
Formulating hypotheses in a chi-square goodness-of-fit test establishes the statistical framework for deciding whether observed categorical data align with an expected distribution. Students rely on these hypotheses to interpret deviations meaningfully.
Understanding the Purpose of Hypotheses in Goodness-of-Fit Testing
In a chi-square goodness-of-fit setting, the hypotheses define what it means for the sample to match or differ from a proposed categorical distribution. Because categorical outcomes can vary randomly from sample to sample, the test assesses whether deviations from expectations are small enough to attribute to chance or large enough to indicate a genuine difference.
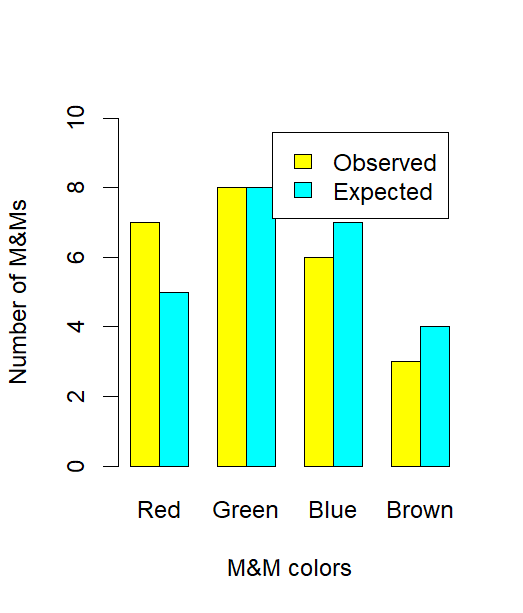
Bar chart comparing observed and expected counts of different M&M colors in a chi-square goodness-of-fit setting. The visual highlights how sample frequencies can deviate from hypothesized proportions. Although the candy context is not required by the syllabus, it provides a clear illustration of comparing observed and expected values. Source.
The Null Hypothesis: Specifying Expected Proportions
The null hypothesis (H0) plays a central role by asserting that the categorical variable follows a known or proposed distribution. These expected proportions typically arise from theoretical reasoning, historical data, or assumptions in a research question. Under the null hypothesis, any variation between observed and expected counts is interpreted as random sampling fluctuation rather than meaningful change.
Null Hypothesis (H0): A statement claiming that the observed distribution of a categorical variable matches a set of specified proportions.
Because the null distribution must be stated before data collection or analysis, formulating H0 requires clearly identifying the proportions for every category. These proportions must sum to 1, ensuring they represent a complete probability distribution. Once established, H0 provides the benchmark used to compute expected counts in the chi-square procedure.
The Alternative Hypothesis: Detecting Differences in the Distribution
The alternative hypothesis (Ha) captures the idea that the actual distribution differs from the expected one. It does not specify which categories differ or by how much. Instead, it states broadly that at least one category’s true proportion is inconsistent with H0.
Alternative Hypothesis (Ha): A statement asserting that at least one category’s proportion differs from the value specified in the null hypothesis.
By using a general rather than category-specific form, the alternative hypothesis supports a flexible test capable of detecting any kind of deviation from the proposed distribution. This open-ended structure makes the chi-square test powerful for identifying distributional differences without requiring directional or category-specific predictions.
Why Hypotheses Must Be Carefully Defined
Clear hypotheses are essential because the chi-square test measures discrepancies relative to the expectations stated in H0. If the expected proportions are poorly defined or misaligned with the research question, the test’s conclusions become misleading. In practice:
The hypotheses determine the expected counts, which directly influence the chi-square statistic’s magnitude.
Misstating H0 changes the distribution being tested, altering the interpretation of the results.
Ha ensures the test evaluates whether observed differences signal a real effect rather than sampling variability.
A well-constructed hypothesis pair therefore ensures the test remains aligned with the question being asked.
Structure of Hypotheses in Categorical Contexts
Formulating hypotheses for a chi-square goodness-of-fit test follows a consistent structure:
H0: The true category proportions equal specified values.
Ha: At least one true proportion differs from its specified value.
This structure reflects the test’s purpose: to determine whether an observed categorical distribution matches an expected one. Importantly, the hypotheses are not expressed in terms of means, medians, or differences between groups. They address only proportions in a single categorical variable.
Considerations When Establishing Expected Proportions
Expected proportions must be:
Explicit, with each category’s proportion defined.
Collectively exhaustive, summing to 1.
Justified, based on context, theory, or prior information.
Once proportions are set, expected counts are derived later in the procedure, allowing evaluation of whether discrepancies reflect meaningful departures from H0.
Relationship Between Hypotheses and the Chi-Square Statistic
The hypotheses form the conceptual backdrop for the chi-square test statistic, which compares observed and expected values. Although the computation occurs in a later stage of the test, the hypotheses determine what values the statistic is measuring against. Without a precisely defined H0, interpreting the magnitude of the chi-square statistic becomes impossible.
EQUATION
= Chi-square statistic measuring discrepancy
= Observed count in a category
= Expected count under the null hypothesis
This equation operationalizes the comparison implied by the hypotheses, linking the conceptual setup to the numerical assessment of fit.
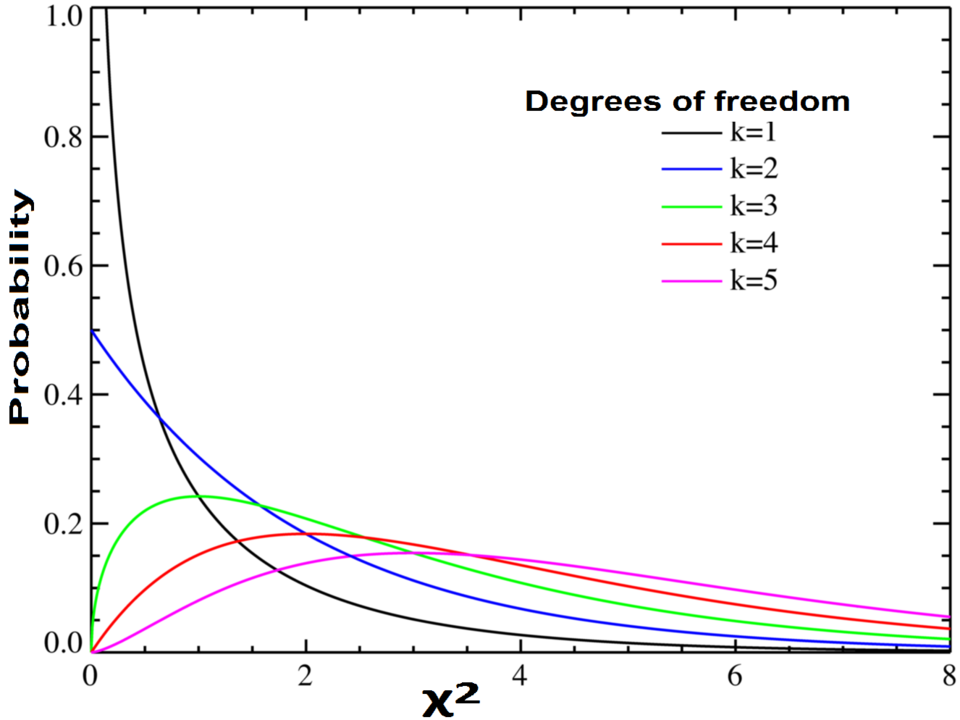
Graph of the probability density function of the chi-square distribution, showing how its shape varies with degrees of freedom. This visual supports understanding of how hypotheses are later evaluated using the chi-square family of distributions. The multiple degrees of freedom provide additional detail beyond the specific subsubtopic. Source.
Logical Foundations Supporting Hypothesis Choice
A chi-square goodness-of-fit test inherently assumes:
The data represent outcomes of a single categorical variable.
Expected proportions reflect a hypothesized distribution.
Observed data provide evidence regarding whether that distribution is plausible.
Formulating H0 and Ha ensures the entire inferential process is rooted in a clear, testable claim regarding the distribution in the population.
Key Features of Strong Hypothesis Formulation
Well-crafted hypotheses in a goodness-of-fit context include:
Precision, specifying all category proportions.
Relevance, connecting to the research question or theoretical distribution.
Testability, allowing statistical comparison through observed and expected counts.
Neutrality, avoiding directional claims not supported by chi-square methodology.
Clear hypotheses support valid and interpretable results, determining the framework through which evidence from the chi-square test is evaluated.
FAQ
Expected proportions represent a complete probability distribution for all categories. If they do not sum to 1, the model for the population is mathematically invalid.
A valid null hypothesis must allocate the entire probability across categories. If the sum differs from 1, expected counts become distorted, leading to incorrect conclusions in the chi-square test.
Yes, provided the previous sample is considered a reliable representation of the population. This is common when historical or long-term data are used.
However, the researcher must justify why those estimates reflect the population at the time of the new study. Using outdated or biased estimates weakens the validity of the test.
A chi-square goodness-of-fit test captures global deviation; it is designed to detect any discrepancy, not directional or category-specific changes.
Including direction or naming categories would require separate tests or contrast hypotheses. The broad form of the alternative hypothesis maintains flexibility and avoids untestable claims.
Categories should be:
• Mutually exclusive
• Collectively exhaustive
• Meaningfully interpretable in context
Merging categories may be necessary when expected counts would otherwise be too small. The choice must be made before data analysis to avoid bias.
Researchers must align expected proportions with the conceptual question at hand. For example, cultural norms, biological theories, or historical records may shape what is considered the expected distribution.
If the research aim concerns detecting deviation from an established pattern, the null hypothesis should reflect that baseline. Clear justification strengthens interpretability and credibility of the test results.
Practice Questions
A researcher proposes that the distribution of four categories in a population follows the proportions 0.20, 0.30, 0.25, and 0.25. State the null and alternative hypotheses for a chi-square goodness-of-fit test for this situation.
Question 1 (1–3 marks)
• Correctly states the null hypothesis: The population proportions are 0.20, 0.30, 0.25, and 0.25. (1 mark)
• Correctly states the alternative hypothesis: At least one true population proportion differs from its stated value. (1 mark)
• Uses appropriate wording for categorical proportions and does not introduce directionality. (1 mark)
A wildlife biologist believes that the proportions of four bird species in a region have changed from historical records, which list the expected proportions as 0.40, 0.30, 0.20, and 0.10.
(a) State the null and alternative hypotheses for a chi-square goodness-of-fit test.
(b) Explain why the alternative hypothesis does not specify which species proportions have changed.
(c) Describe how incorrect specification of the expected proportions in the null hypothesis could affect the conclusions of the chi-square test.
Question 2 (4–6 marks)
(a)
• Correct null hypothesis: The population proportions are 0.40, 0.30, 0.20, and 0.10. (1 mark)
• Correct alternative hypothesis: At least one true proportion differs from the stated values. (1 mark)
(b)
• Explains that the chi-square goodness-of-fit test is non-directional and detects any departure from the expected distribution. (1 mark)
• Notes that the test does not test category-specific changes, only overall differences in distribution. (1 mark)
(c)
• States that incorrect expected proportions would alter the expected counts used in the test. (1 mark)
• Explains that this could lead to misleading conclusions because the chi-square statistic measures deviation from incorrectly specified expectations. (1 mark)
