
AP Syllabus focus:
‘The chi-square test for goodness of fit is appropriate when analyzing the distribution of proportions for a single categorical variable, comparing observed counts to expected counts based on a specified distribution.’
Selecting the appropriate chi-square goodness of fit test is essential when evaluating how well observed categorical data align with expected proportions under a stated null hypothesis. These notes explain when and why this test is used.
Understanding the Purpose of the Goodness of Fit Test
The chi-square goodness of fit test is designed to assess whether the distribution of a single categorical variable in a sample is consistent with an expected distribution. This expected distribution must come from a clearly stated null hypothesis, which specifies the proportions believed to represent the population.
The test focuses entirely on comparing observed counts, which are the frequencies recorded in the sample, to expected counts, the model-based values derived under the assumption that the null hypothesis is true. This alignment between observed and expected frequencies reveals whether sample data deviate from assumptions in a way that is unlikely to be due to random chance.
When the Chi-Square Goodness of Fit Test Is Appropriate
The test applies only in situations involving one categorical variable, and each observational unit must fall into exactly one category. It is used when a researcher wants to determine whether the sample distribution differs from a hypothesized distribution.
Key conditions justifying its use include:
The study involves one categorical variable with two or more categories.
Expected proportions for each category are known or specified in advance.
The goal is to evaluate whether the observed data fit this expected pattern.
These requirements ensure that the chi-square goodness of fit test addresses the correct inferential question and that the mathematics behind the test is applied appropriately.
Understanding Observed and Expected Counts
Observed counts represent the actual frequencies recorded in each category of the sample. These numbers reflect the real outcomes collected through random sampling or experimentation.
Expected counts are calculated values indicating what the distribution would look like if the null hypothesis were true. After introducing expected counts, their definition follows.
Expected Count: The value obtained by multiplying the total sample size by the null proportion for a specific category.
Expected counts serve as the benchmark for evaluating discrepancies. Large differences between observed and expected values suggest a possible mismatch between the hypothesized and actual distributions.
A normal sentence follows here to maintain required spacing and narrative continuity.
Rationale for Using the Test
The goodness of fit test evaluates whether deviations between observed and expected counts are due to random sampling variation or whether they signal a meaningful difference from the hypothesized distribution. The chi-square statistic quantifies these deviations and supports a probability-based decision regarding the null hypothesis.
The test is especially useful in situations where proportions must match a theoretical model, such as genetics ratios, consumer preferences, or survey response distributions. Its applicability hinges on its ability to measure the overall discrepancy across all categories rather than focusing on any single category in isolation.
Core Components Required Before Selecting the Test
Before selecting this test, students must confirm several essential elements:
Clear expected proportions for each category.
Adequate sample size, ensuring expected counts are sufficiently large.
Random sampling or random assignment, supporting valid inference.
These elements create conditions under which the chi-square distribution provides accurate reference values for decision-making.
Why the Test Uses the Chi-Square Distribution
The chi-square distribution is appropriate because the test statistic is always positive and becomes larger when observed and expected counts differ substantially. Its right-skewed shape reflects the fact that extremely large discrepancies are unlikely under the null hypothesis.
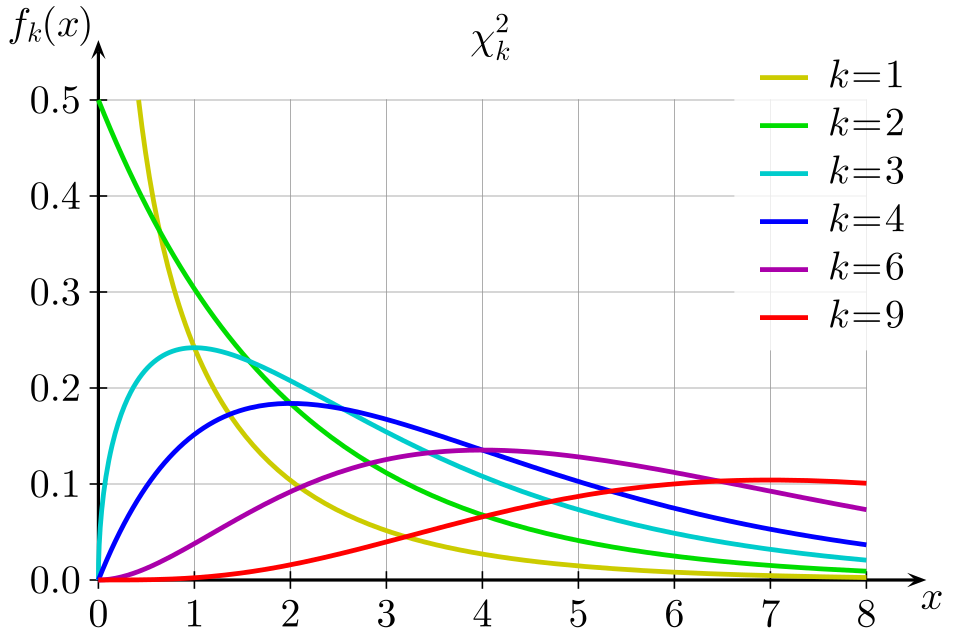
This diagram compares chi-square distributions with various degrees of freedom, illustrating how the distribution becomes less skewed as degrees of freedom increase. It reinforces that the chi-square statistic is nonnegative and that its reference distribution depends on degrees of freedom. Source.
Although not computed in this subsubtopic, the concept of using chi-square as a measure of overall discrepancy informs why this test is selected for categorical data comparisons.
Structural Logic Behind Selecting This Test
Students should understand the reasoning process leading to the selection of the goodness of fit test. The following points outline this logical structure:
Identify that the question concerns one categorical variable.
Determine that the goal is to compare a set of observed counts with those predicted by a specific distribution.
Recognize that no comparison is being made between two groups, and no relationship between variables is being studied.
Conclude that the chi-square goodness of fit test is the only inference procedure designed for this scenario.
Indicators That This Is Not the Correct Test
To prevent misapplication, students should confirm that:
The data do not involve two categorical variables (which would require a test of independence or homogeneity).
There is no comparison between proportions from different groups.
The expected distribution is known or can be justified; otherwise, the test cannot be performed.
These distinctions help ensure appropriate selection among categorical inference procedures.
Summary of the Selection Process
To select the chi-square goodness of fit test, students should:
Verify that the study examines one categorical variable.
Ensure that expected proportions are explicitly stated.
Confirm that the purpose is to test whether the observed sample distribution matches the expected distribution.
Check that conditions for inference are satisfied, particularly regarding expected counts and independence.
Using this structured approach ensures that the chi-square goodness of fit test is chosen precisely when it is the proper inferential tool for analyzing categorical data.
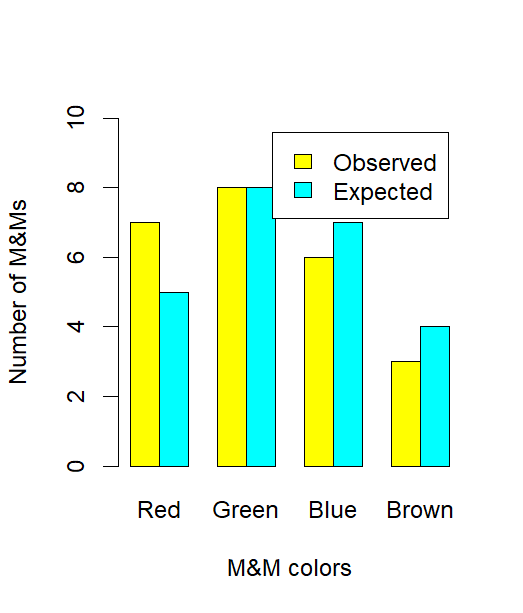
This bar chart contrasts observed and expected counts for several categories, illustrating how discrepancies between the two are visually assessed in a goodness-of-fit setting. Although the specific context shows candy colors, the structure of paired bars applies to any single-variable chi-square comparison. Source.
FAQ
The chi-square goodness of fit test compares an entire distribution across multiple categories at once, rather than a single proportion or comparison of two proportions.
A test for proportions concerns one category at a time, whereas the goodness of fit test evaluates whether the full set of observed frequencies aligns with a specified model.
Goodness of fit is used when the question concerns how well a proposed distribution fits, not whether individual proportions differ.
The test cannot be applied unless expected proportions are known, because these proportions determine the expected counts used to evaluate discrepancies.
Without a predetermined distribution, the chi-square statistic has no meaningful reference against which differences in observed frequencies can be judged.
Specifying expectations also prevents data-driven hypotheses, which would invalidate inference.
Yes. Increasing the number of categories increases the degrees of freedom and alters the shape of the chi-square distribution used for inference.
More categories also require verifying that each expected count is sufficiently large.
If several categories have very small expected counts, the test becomes unsuitable, and categories may need to be combined before selection.
Yes. Many applications use theoretical models such as equal proportions, genetic ratios, or manufacturer claims about distribution.
The key requirement is that the theoretical distribution must be justified independently from the observed data.
As long as the model is established beforehand, the goodness of fit test can be appropriately selected.
Random sampling ensures that deviations between observed and expected counts reflect population behaviour rather than systematic selection bias.
If the sample is not random, differences might arise from sampling method rather than lack of fit, undermining the validity of selecting this test.
Randomness also supports the assumption that the chi-square distribution approximates the sampling distribution of the test statistic.
Practice Questions
A researcher wants to determine whether a sample of 120 survey responses fits a claimed distribution of preferences across four categories. Under what conditions is the chi-square goodness of fit test appropriate for this situation? (1–3 marks)
Question 1 (1–3 marks)
1 mark: States that the test requires one categorical variable with two or more categories.
1 mark: Mentions that expected proportions must be specified under a null hypothesis.
1 mark: Notes that the goal is to compare observed counts with expected counts based on the claimed distribution.
A wildlife biologist claims that the distribution of bird species in a protected area follows specified proportions: 40% species A, 30% species B, 20% species C, and 10% species D. From a random sample of 200 birds, the observed counts are: A = 70, B = 68, C = 44, D = 18.
(a) Explain why the chi-square goodness of fit test is the appropriate inference procedure here.
(b) State the null and alternative hypotheses for the test.
(c) Describe how the expected counts would be calculated for each category. (4–6 marks)
Question 2 (4–6 marks)
Part (a) (1–2 marks)
1 mark: Identifies that only one categorical variable (bird species) is being analysed.
1 mark: States that the purpose is to assess whether observed frequencies match specified proportions.
Part (b) (1–2 marks)
1 mark: Null hypothesis: the population distribution of species matches the stated proportions.
1 mark: Alternative hypothesis: the population distribution of species does not match the stated proportions (at least one proportion differs).
Part (c) (1–2 marks)
1 mark: States that expected counts are found by multiplying the total sample size by each specified proportion.
1 mark: Provides at least one correct example of how this calculation would be performed (numerical values not required).
