
AQA Specification focus:
‘The concept of the marginal propensity to consume and use the marginal propensity to consume to calculate the size of the multiplier.’
Introduction
The marginal propensity to consume (MPC) and the multiplier are central to understanding how spending decisions influence national income. They link microeconomic behaviour with macroeconomic outcomes.
Marginal Propensity to Consume (MPC)
Defining MPC
The marginal propensity to consume measures how much of an extra pound of disposable income households spend on consumption rather than saving.
Marginal Propensity to Consume (MPC): The fraction of additional income that households spend on consumption rather than saving.
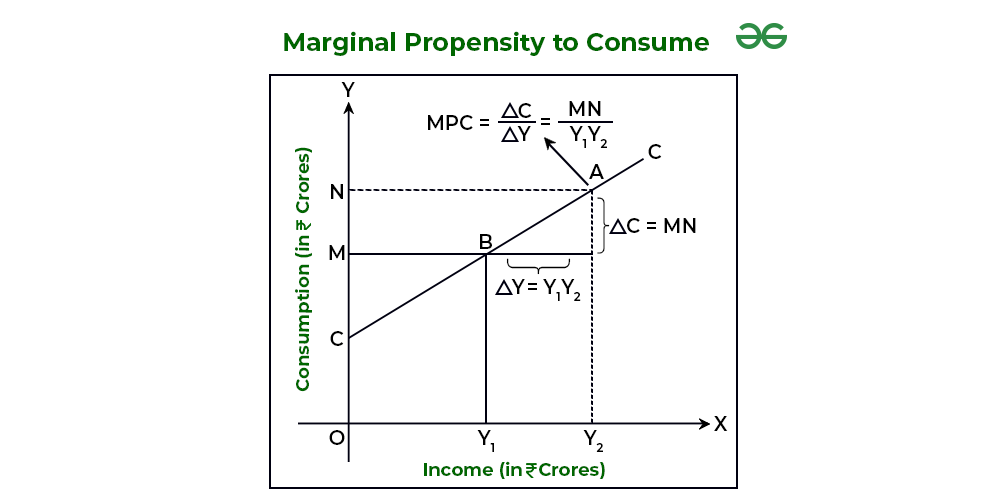
The diagram shows the consumption function, where the slope represents the marginal propensity to consume (MPC). A steeper slope indicates a higher MPC, meaning households spend a larger portion of additional income. Source
For example, if households receive an extra £100 and spend £80, the MPC is 0.8.
Importance of MPC
The MPC is vital because:
It influences the strength of the multiplier effect.
A higher MPC means spending circulates more quickly in the economy.
A lower MPC means more income is withdrawn as savings, reducing the multiplier.
The Multiplier Concept
Defining the Multiplier
The multiplier explains how an initial change in spending leads to a larger change in national income.
Multiplier: The process by which an initial injection of spending into the economy leads to a greater final increase in national income.
This occurs because one person’s expenditure becomes another person’s income, which then stimulates further rounds of spending.
Linking MPC and the Multiplier
The Relationship
The size of the multiplier is directly linked to the MPC:
Higher MPC → larger multiplier.
Lower MPC → smaller multiplier.
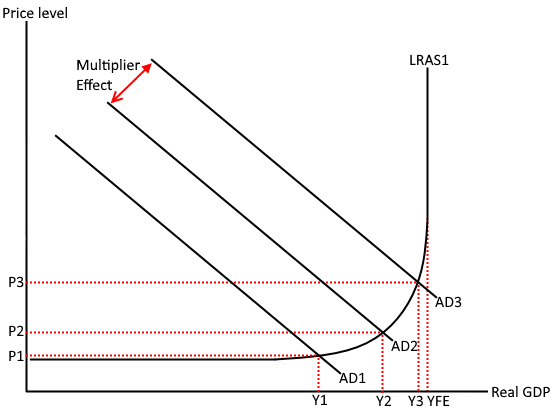
The diagram illustrates the multiplier effect using an AD/AS model. An initial increase in AD shifts the curve rightward, leading to a larger increase in output and income, demonstrating the concept of the multiplier. Source
This relationship exists because the MPC determines how much income continues to circulate with each spending round.
The Multiplier Equation
Multiplier (k) = 1 ÷ (1 - MPC)
k = multiplier size (no units, ratio form)
MPC = marginal propensity to consume (proportion of income spent)
This equation shows that as the MPC approaches 1 (all extra income spent), the multiplier becomes very large. If the MPC is low, the multiplier is smaller.
Illustrating the Process
Step-by-Step Flow of Spending
When new spending enters the economy, the following occurs:
An initial injection of demand is made (for example, government spending).
This creates new income for households and firms.
A proportion of this income (determined by the MPC) is spent on goods and services.
That spending becomes new income for others, repeating the cycle.
The total rise in national income is greater than the initial injection.
Withdrawals in the Process
However, the cycle is limited because of withdrawals (savings, taxes, imports):
If households save more, the MPC falls and the multiplier weakens.
Higher taxation reduces disposable income and lowers the MPC.
Imports redirect spending abroad, reducing domestic income circulation.
Factors Influencing MPC and the Multiplier
Economic Factors
The size of the MPC (and hence the multiplier) depends on:
Household income levels: Low-income households tend to have higher MPCs.
Consumer confidence: Optimistic households are more likely to spend extra income.
Taxation levels: Higher taxes reduce disposable income, lowering MPC.
Access to credit: Easier borrowing can raise MPC by encouraging higher spending.
Policy Implications
Governments often use fiscal policy, such as public spending programmes, knowing that the multiplier will magnify the effects on national income.
In recessions, boosting aggregate demand via spending can trigger a strong multiplier effect, provided MPC is high.
If MPC is low, injections may have weaker effects, limiting policy effectiveness.
Why MPC Determines Multiplier Size
The link between MPC and the multiplier is critical:
A high MPC means households re-spend most new income, generating strong successive rounds of demand.
A low MPC means more income leaks out as savings or withdrawals, reducing the extent of the income rise.
Thus, the MPC acts as the key determinant of the magnitude of the multiplier effect in the economy.
Practice Questions
Define the term marginal propensity to consume (MPC). (2 marks)
1 mark for recognising it relates to spending out of additional income.
1 mark for clear definition: the proportion of extra income that is spent on consumption rather than saved.
Explain the relationship between the marginal propensity to consume (MPC) and the size of the multiplier. (6 marks)
1 mark for stating that a higher MPC leads to a larger multiplier.
1 mark for stating that a lower MPC leads to a smaller multiplier.
2 marks for clear explanation of why: because higher MPC means more successive rounds of spending in the economy.
1 mark for reference to the multiplier formula (1 ÷ (1 - MPC)) or equivalent understanding.
1 mark for a developed point on the role of withdrawals (savings, taxes, imports) limiting the effect.
FAQ
The APC measures the proportion of total income spent on consumption, while the MPC measures the proportion of additional income spent.
For example, a household earning £20,000 and spending £15,000 has an APC of 0.75. If an extra £1,000 income leads to £800 additional spending, the MPC is 0.8.
MPC is influenced by factors such as:
Income level: Lower-income households usually have higher MPCs.
Access to credit: Those with loans may spend more of new income.
Savings preferences: Cautious households save more, lowering MPC.
This variation explains why government policies affect groups differently.
In some societies, cultural norms encourage saving for future generations, lowering MPC.
In others, cultural emphasis on consumption and material goods leads to higher MPC, meaning income is more likely to be spent rather than saved.
As income increases, households are more likely to meet their basic needs and save additional income rather than spend it.
At higher income levels, the share of income used for luxury goods grows more slowly compared with the rise in total income, reducing MPC.
Policies can shape MPC by altering disposable income and incentives:
Tax cuts raise disposable income, often increasing MPC.
Welfare benefits to low-income groups usually create higher MPC effects.
Incentives for saving, such as tax-free accounts, can reduce MPC.
