
AQA Specification focus:
‘The concept of the economic cycle and the use of a range of economic indicators, such as real GDP, the rate of inflation, unemployment and investment, to identify the various phases of the economic cycle.’
Economic cycles explain fluctuations in national output over time. They reveal periods of growth, slowdown, recession and recovery, tracked through measurable indicators that reflect overall economic performance.
The Economic Cycle
The economic cycle (also called the business cycle) refers to the recurring pattern of economic expansion and contraction in real national output over time. It highlights the dynamic nature of economies, showing how growth is not constant but instead moves through distinct phases.
Economic Cycle: The recurring fluctuations in real national output consisting of periods of expansion, peak, contraction and recovery.
The cycle typically follows four phases:
Expansion (boom): Rapid growth in output and employment.
Peak: The maximum point of activity before a downturn.
Contraction (recession): Falling output and rising unemployment.
Trough (slump): The lowest point, before recovery begins.
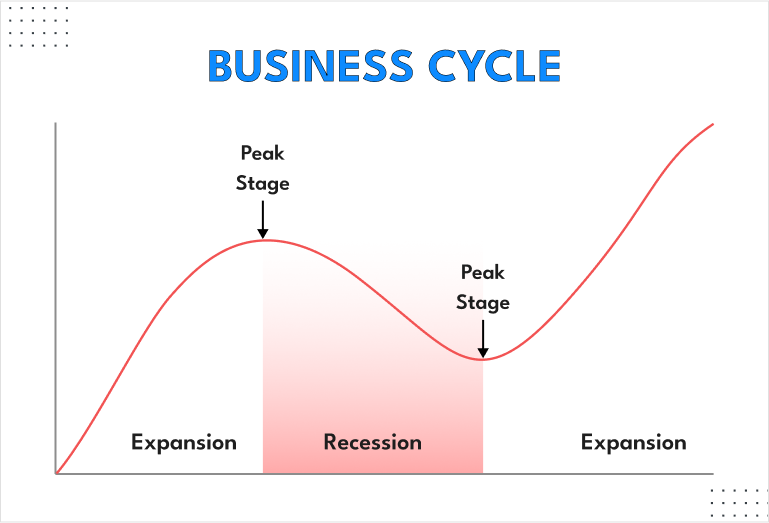
This diagram depicts the four phases of the business cycle: expansion, peak, contraction, and trough, highlighting the cyclical nature of economic activity. Source
These phases demonstrate how economies rarely grow smoothly but experience instability, influenced by both domestic and global factors.
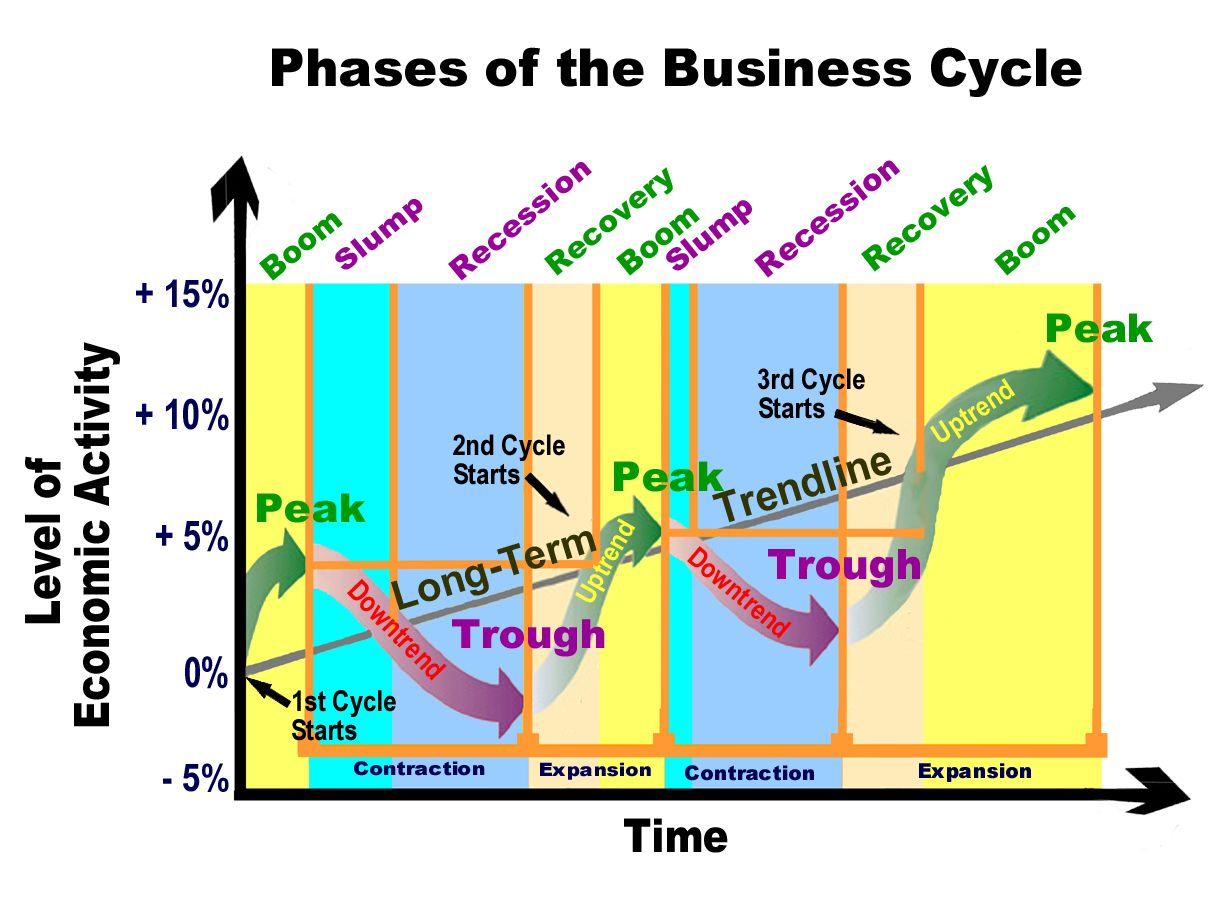
An annotated diagram illustrating the various phases of the economic cycle, showing the fluctuations in GDP over time and highlighting periods of boom and slump. Source
Indicators of the Economic Cycle
A range of economic indicators are used to identify the phases of the cycle. These indicators provide measurable evidence of changes in economic activity.
Real GDP
Real GDP measures the value of goods and services produced in an economy adjusted for inflation. It is the primary indicator of overall output.
Rising real GDP signals expansion.
Falling real GDP over two consecutive quarters is the technical definition of a recession.
Real GDP: The inflation-adjusted value of all final goods and services produced in an economy within a given period.
Rate of Inflation
Inflation is the sustained increase in the general price level.
Moderate inflation is common in periods of growth due to increased demand.
Falling or negative inflation may indicate weak demand during downturns.
High and accelerating inflation often accompanies booms, while disinflation or deflation may occur during recessions.
Unemployment
Unemployment levels fluctuate significantly across the cycle.
In expansions, unemployment tends to fall as firms hire more labour.
In contractions, rising job losses push unemployment higher.
Unemployment acts as a lagging indicator, as businesses often adjust employment levels after other conditions change.
Investment
Investment is expenditure on capital goods by firms.
During expansion, firms invest heavily to meet growing demand.
In recessions, uncertainty and falling demand reduce investment spending.
Investment is a leading indicator, often falling before output contracts more widely.
Linking Indicators to Cycle Phases
Each indicator helps identify the position of the economy within the cycle:
Expansion: Rising GDP, falling unemployment, increasing investment, higher inflation.
Peak: GDP growth slows, inflation pressures build, investment may plateau.
Contraction: Falling GDP, rising unemployment, declining investment, easing inflation.
Trough: GDP stabilises, unemployment peaks, low inflation or deflation possible.
This relationship ensures policymakers, firms and households can interpret economic conditions and adjust their decisions accordingly.
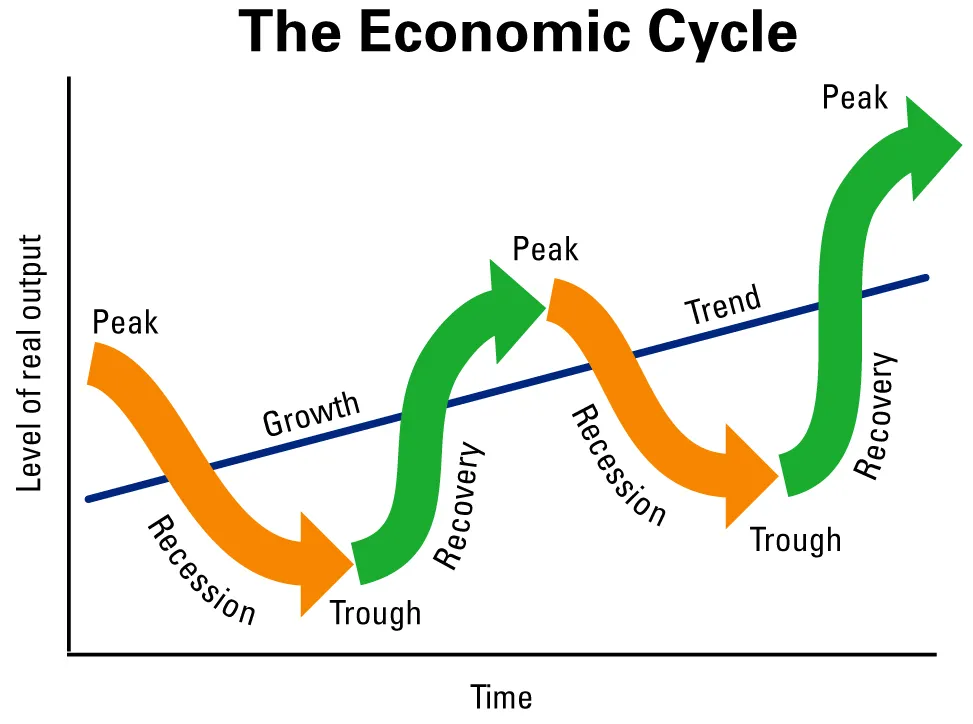
A stylised diagram of the economic cycle, illustrating the recurring pattern of expansion and contraction in economic activity over time. Source
Lagging, Leading and Coincident Indicators
Economic indicators differ in how they align with changes in the cycle:
Leading indicators: Change before the economy (e.g., investment, consumer confidence).
Coincident indicators: Move in line with the economy (e.g., real GDP, industrial output).
Lagging indicators: Change after the economy has shifted (e.g., unemployment, inflation).
Understanding these categories is crucial for anticipating future changes in the cycle.
Short-Term vs Long-Term Trends
The economic cycle reflects short-term fluctuations, while the long-term trend rate of growth represents the overall increase in productive capacity. Policymakers aim to distinguish between temporary cyclical changes and permanent shifts in potential output.
Why Economic Cycles Matter
Analysing the economic cycle is important because:
Governments use fiscal and monetary policy to stabilise fluctuations.
Businesses adjust investment and hiring decisions.
Individuals experience direct impacts on employment, wages and prices.
Excessive instability can damage confidence, while steady, predictable growth encourages planning and investment.
Practice Questions
Using economic indicators, explain how policymakers can identify different phases of the economic cycle. (6 marks)
Up to 2 marks for reference to real GDP as the main measure of output (e.g., rising GDP = expansion, falling GDP = contraction).
Up to 2 marks for reference to unemployment (e.g., low unemployment in expansion, rising unemployment in contraction).
Up to 2 marks for reference to either inflation or investment (e.g., rising inflation/investment during booms, lower or falling values during recessions).
Maximum 6 marks: award development marks for clear linkage between the indicator and the specific phase of the economic cycle.
Define the term economic cycle. (2 marks)
1 mark for identifying that the economic cycle refers to fluctuations/recurring changes in economic activity/output.
1 mark for mentioning the phases (e.g., expansion/boom, peak, contraction/recession, trough/slump).
FAQ
Leading indicators change before the wider economy does, helping predict future activity (e.g., investment levels, consumer confidence).
Coincident indicators move in line with the economy, reflecting current conditions (e.g., real GDP, industrial output).
Lagging indicators respond after the economy has shifted, confirming trends already underway (e.g., unemployment, inflation).
Investment is highly sensitive to changes in confidence and demand, making it a strong predictor of turning points in the cycle.
Rising investment often signals future growth as firms expand capacity.
Falling investment usually precedes a downturn as businesses anticipate weaker demand.
This forward-looking nature makes it especially important for policymakers.
During expansions, higher demand pressures often lead to rising inflation. If growth accelerates too quickly, inflation may become excessive.
At the peak, inflationary pressures tend to be strongest as resources are fully utilised.
In contractions, weaker demand reduces price pressures, and in severe recessions, disinflation or even deflation may occur.
Businesses are cautious when changing staffing levels. They often delay hiring during early recovery until growth appears sustainable.
Similarly, in downturns, firms may cut costs elsewhere before reducing labour, meaning job losses occur after output has already fallen.
This delay explains why unemployment is classified as a lagging indicator.
Data is often published with a time lag, so policymakers may react after conditions have already shifted.
Revisions to GDP and inflation figures can change the interpretation of past phases.
Short-term shocks or seasonal variations may distort trends, making it harder to judge whether the economy is genuinely expanding, contracting, or stabilising.
