
AQA Specification focus:
‘Students should be able to use a production possibility curve and AD/AS diagrams to illustrate the distinction between short-run and long-run economic growth.’
Introduction
Economic growth can be shown using different models. The production possibility curve (PPC) and the aggregate demand and aggregate supply (AD/AS) model highlight the contrast between short-run and long-run growth.
Economic Growth: An Overview
Economic growth refers to an increase in the real national output of an economy over time. Economists distinguish between short-run economic growth, caused by the utilisation of existing resources, and long-run economic growth, driven by increases in productive capacity.
The Production Possibility Curve (PPC)
The PPC illustrates the maximum possible combinations of two goods or services an economy can produce, given its current resources and technology.
Production Possibility Curve (PPC): A curve showing the maximum output combinations of two goods that an economy can achieve when all resources are fully and efficiently utilised.
A movement from inside the curve to a point on the curve represents short-run growth, while an outward shift of the curve reflects long-run growth.
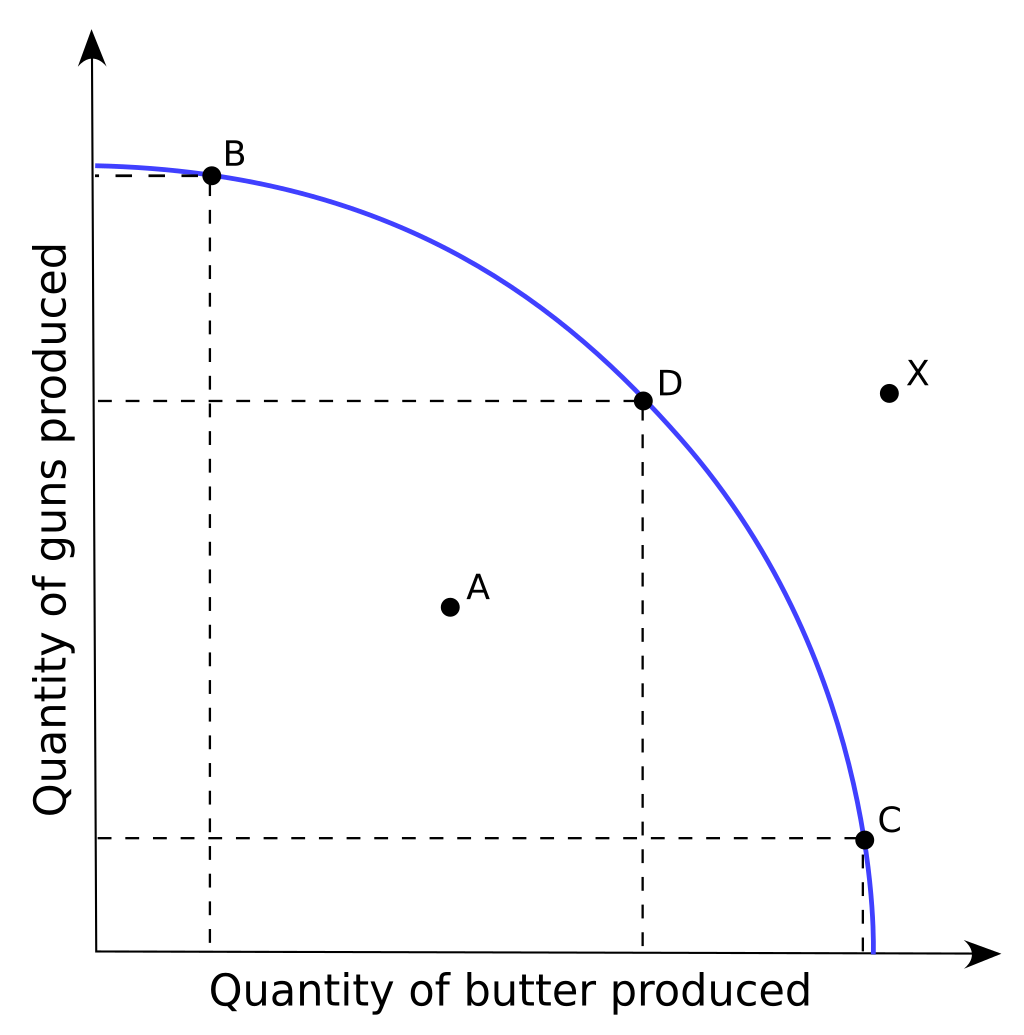
The Production Possibilities Frontier (PPF) demonstrates the maximum output combinations of two goods an economy can achieve. Points on the curve represent efficient production, while points inside indicate underutilization of resources. An outward shift of the PPF signifies long-run economic growth due to increased resources or technological advancements. Source
Short-run Growth on the PPC
Occurs when previously unused or underused resources (such as unemployed labour) are mobilised.
Illustrated by moving from a point inside the PPC to a point closer to the frontier.
Driven largely by demand-side factors, such as increases in consumption, investment, government spending, or net exports.
Long-run Growth on the PPC
Involves an expansion of the economy’s productive capacity.
Illustrated by an outward shift of the PPC.
Caused by supply-side improvements, such as:
Better education and training improving labour productivity.
Investment in new technology.
Increases in the stock of capital.
Discovery of new resources.
The Aggregate Demand and Aggregate Supply (AD/AS) Model
The AD/AS framework is central to macroeconomic analysis of growth. It allows us to examine both short-run fluctuations in output and the long-run trend rate.
Aggregate Demand (AD): The total demand for goods and services in an economy at a given price level, composed of consumption, investment, government spending, and net exports.
Aggregate Supply (AS): The total quantity of goods and services that producers in an economy are willing and able to supply at a given overall price level.
Short-run Growth with AD/AS
Represented by a rightward shift of the AD curve, moving output closer to the full employment level.
May occur due to increases in consumer confidence, rising investment, expansionary fiscal policy, or low interest rates.
Output rises, but pressure on resources can lead to demand-pull inflation.
Long-run Growth with AD/AS
Represented by a rightward shift of the long-run aggregate supply (LRAS) curve, reflecting greater productive potential.
Linked to improvements in efficiency, productivity, or factor endowments.
Sustained growth without inflationary pressures, as the economy can now produce more at the same price level.
Linking PPC and AD/AS Models
Both models explain the distinction between short-run and long-run growth:
Short-run growth
PPC: Movement from within the curve to the frontier.
AD/AS: Shift of AD to the right, moving towards potential output.
Long-run growth
PPC: Outward shift of the entire curve.
AD/AS: Outward shift of the LRAS curve, expanding the economy’s productive potential.

The Aggregate Supply and Demand (AS-AD) model illustrates the relationship between total output and the price level in an economy. Short-run economic growth is represented by a rightward shift of the AD curve, leading to increased output and price levels. Long-run growth is shown by a rightward shift of the AS curve, indicating an increase in the economy's productive capacity. Source
Determinants of Short-run Growth (Demand-side)
Rising consumer spending due to confidence or higher disposable income.
Increased government expenditure.
Higher investment in physical capital.
Stronger export demand supported by favourable exchange rates or global growth.
Determinants of Long-run Growth (Supply-side)
Labour force growth through immigration or demographic changes.
Capital deepening: More machines and technology per worker.
Human capital improvements: Better education and training.
Technological progress increasing efficiency.
Institutional changes such as improved regulation, competition policies, or property rights.
Implications for Economic Policy
Policies targeting short-run growth often focus on stimulating demand, e.g., monetary easing or fiscal stimulus.
Policies for long-run growth focus on improving supply conditions, e.g., investment in infrastructure, innovation, or structural reforms.
Policymakers must balance between stimulating demand for immediate recovery and ensuring supply-side improvements for sustainable growth.
Practice Questions
Using a Production Possibility Curve (PPC), explain the difference between short-run economic growth and long-run economic growth. (2 marks)
1 mark for stating that short-run growth is shown by a movement from a point inside the PPC to a point on the curve.
1 mark for stating that long-run growth is shown by an outward shift of the entire PPC.
With reference to an Aggregate Demand and Aggregate Supply (AD/AS) diagram, explain how both short-run and long-run economic growth can occur in an economy. (6 marks)
Up to 2 marks for correctly describing short-run growth as a rightward shift of the AD curve, leading to higher output closer to potential GDP.
Up to 2 marks for correctly describing long-run growth as a rightward shift of the LRAS curve, increasing productive capacity.
Up to 2 marks for using a correctly drawn and labelled AD/AS diagram, showing both AD shifting and LRAS shifting, with clear identification of short-run and long-run effects.
FAQ
The PPC demonstrates opportunity cost because producing more of one good means producing less of another. When the PPC shifts outward, it indicates that opportunity costs still exist, but the overall potential output of the economy has increased. This reflects long-run economic growth while maintaining the trade-offs inherent in resource allocation.
A rightward shift in AD can increase output in the short run but may only cause inflationary pressure if the economy is already near full capacity. Without supply-side improvements—such as better productivity, new technology, or resource growth—the economy cannot sustain higher growth levels in the long run.
Yes, it is possible. If the productive capacity expands due to technological innovation or labour force growth, the PPC and LRAS can shift outward. However, if demand does not rise to match this new capacity, the economy may not immediately experience higher output levels, even though long-run growth potential has increased.
Advances in technology.
Improvements in education and workforce skills.
Expansion of physical capital, such as infrastructure or machinery.
Growth in natural resource availability.
Institutional reforms, such as better regulation or stronger property rights.
Each of these contributes to sustained increases in an economy’s productive capacity, representing long-run growth.
The PPC provides a broad overview of the economy’s maximum potential output, useful for visualising resource efficiency and growth. The AD/AS model goes further by showing how price levels interact with changes in demand and supply. Together, they allow students to distinguish clearly between short-run fluctuations in demand and long-run shifts in productive capacity.
