
AQA Specification focus:
‘The formal diagrammatic analysis of the monopoly model.’
Monopoly models explain how a single firm dominates a market, sets prices, and maximises profit. Understanding diagrams and theory is central to AQA A-Level Economics.
Characteristics of a Monopoly
A monopoly exists when a single firm is the sole provider of a good or service, usually due to barriers preventing new firms from entering. This unique structure means the monopolist faces the entire industry demand curve, unlike firms in competitive markets.
Single seller dominates the market.
High barriers to entry prevent new competitors.
Price-making power allows the monopolist to control output and prices.
Downward-sloping demand curve reflects that lower prices are needed to sell more output.
Because the monopolist controls supply, it must consider both average revenue (AR) and marginal revenue (MR) when making decisions.
Revenue in Monopoly
The monopolist’s AR curve is the same as the market demand curve, showing the average price at different output levels. Since the monopolist must reduce price to sell more, MR always falls faster than AR.
Marginal Revenue (MR): The additional revenue earned from selling one more unit of output.
This distinction is crucial because it affects where profit maximisation occurs.
Profit Maximisation in Monopoly
The traditional theory assumes firms aim to maximise profit. For monopolies, this occurs where marginal cost (MC) = marginal revenue (MR).
EQUATION
Profit Maximisation Condition: MR = MC
MR = Marginal Revenue, the change in total revenue when one more unit is sold
MC = Marginal Cost, the change in total cost when one more unit is produced
At this point, producing one extra unit would add more to cost than to revenue, reducing overall profit.
Steps in Monopoly Profit Maximisation
Identify where MR = MC on the diagram.
Determine the corresponding output level (Q*).
From that output, go up to the AR curve to find the price (P*).
Profit is measured by the vertical gap between AR and AC at Q*.
The monopolist chooses Q* and P* to maximise profit, not necessarily to maximise efficiency.
The monopolist sets Q* where MR = MC and then charges the price on the AR (demand) curve corresponding to that quantity.
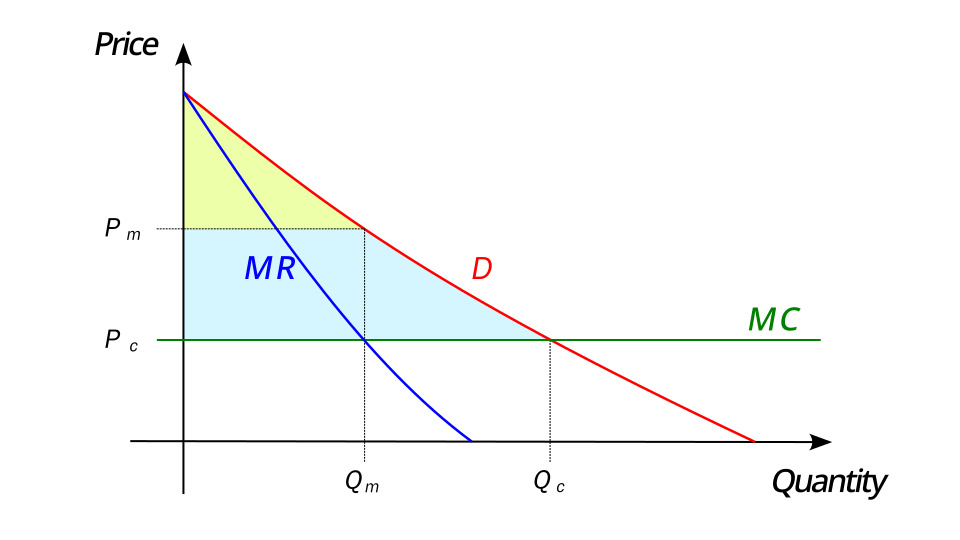
Monopoly profit maximisation occurs where MR intersects MC. Price is then read up to the AR (demand) curve, giving Pm at Qm. This diagram focuses on single-price monopoly profit choice; if any competitive benchmarks are shown, treat them as background only. Source
Diagrammatic Representation
In the standard monopoly diagram:
The AR curve slopes downward.
The MR curve lies below AR.
The MC curve intersects MR at Q*.
The AC curve shows average costs.
At Q*, the monopolist sets price from AR, creating supernormal profit if P > AC.
Supernormal Profit: Profit greater than normal profit, occurring when total revenue exceeds total cost (including opportunity costs).
This profit is often sustained in the long run due to barriers to entry.
With a straight-line AR curve, MR shares the same price intercept and has twice the slope, so it reaches zero at half the AR-intercept quantity.
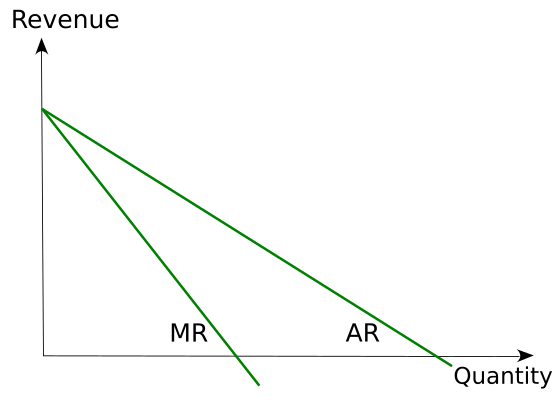
For a linear demand curve, MR lies below AR and is twice as steep. This geometric relationship underpins the MR = MC profit rule in monopoly. Use it to read off Q and the associated price consistently. Source
Short-Run vs Long-Run Monopoly Outcomes
Short Run
Monopolies can make supernormal profit, normal profit, or even losses, depending on demand and costs.
The MR = MC rule still applies, regardless of outcome.
Long Run
Unlike competitive markets, monopolies can maintain supernormal profit in the long run.
Barriers to entry such as patents, economies of scale, or brand loyalty prevent new entrants from eroding profits.
Implications of Monopoly Profit Maximisation
Monopoly profit maximisation has several important consequences:
For Consumers
Higher prices than in competitive markets.
Restricted output compared with allocative efficiency levels.
Consumer surplus reduction as monopolists capture more welfare as profit.
For Firms
Sustained supernormal profits allow reinvestment in research and development.
Market power strengthens through branding and economies of scale.
X-inefficiency may develop, as lack of competition reduces incentives to minimise costs.
X-Inefficiency: Inefficiency arising when a firm does not minimise costs, often due to lack of competitive pressure.
For Market Efficiency
Allocative inefficiency: Price (P) is above marginal cost (MC), meaning resources are not distributed according to consumer preferences.
Productive inefficiency: Output does not occur at the lowest point of the AC curve.
Dynamic efficiency: Possible improvement if supernormal profits fund innovation.
If MR exceeds MC, increasing output raises profit; if MC exceeds MR, reducing output raises profit.
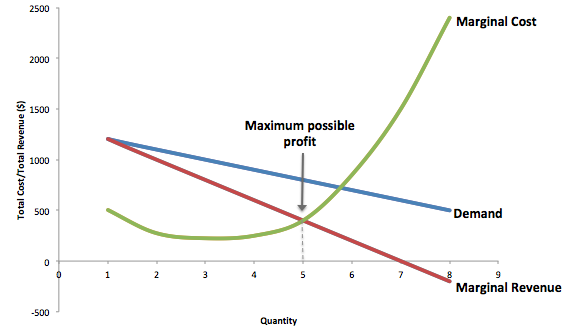
The monopoly chooses the quantity where MR equals MC. To set price, move vertically to the demand (AR) curve. This figure emphasises the decision rule rather than the profit area, which you can add on the standard AC-inclusive diagram. Source
Key Diagram Features to Remember
When drawing or interpreting monopoly diagrams, always ensure:
MR falls below AR.
Profit maximisation occurs at MR = MC.
Price is read from the AR curve at output Q*.
Supernormal profit is the area between AR and AC at Q*.
These elements show clearly how monopolies differ from perfect competition.
Practice Questions
Define the profit-maximising condition for a monopoly and explain briefly what it means. (2 marks)
1 mark for stating the condition correctly: profit maximisation occurs where MR = MC.
1 mark for brief explanation: for example, “at this point, producing an extra unit would add the same to revenue as to cost, beyond which profit would fall.”
Using an appropriate diagram, explain how a monopolist determines its profit-maximising price and output. (6 marks)
1 mark for drawing a clear monopoly diagram with AR and MR curves.
1 mark for including MC and AC curves correctly.
1 mark for correctly identifying the output level where MR = MC.
1 mark for showing the corresponding price on the AR (demand) curve.
1 mark for shading or identifying the area of supernormal profit (if P > AC).
1 mark for explanation in text: monopolist chooses output where MR = MC, then sets the highest price consumers are willing to pay from the AR curve.
FAQ
Marginal revenue falls faster than average revenue because the monopolist must lower the price on all units sold to sell an additional unit. This means the extra revenue gained from selling one more unit is less than the price charged.
As output increases, the gap between AR and MR widens, explaining why MR always lies below AR in monopoly models.
A steep (inelastic) demand curve allows the monopolist to set higher prices without losing many customers, leading to greater potential profit.
A flatter (elastic) demand curve restricts pricing power, as consumers are more responsive to changes in price.
Profit levels depend not just on demand and revenue but also on cost conditions.
If AC is low relative to AR, supernormal profits are likely.
If AC is high, profits may shrink to normal or even losses, despite monopoly power.
A monopolist maximises profit at MR = MC, not where price equals marginal cost.
This leads to restricted output compared with allocative efficiency, where P = MC. As a result, society experiences deadweight loss due to underproduction.
Yes. If average costs exceed the price consumers are willing to pay at the MR = MC output, the monopolist makes a loss.
Short-run losses may occur due to high fixed costs or temporary falls in demand, but monopolists may continue to operate if they can cover variable costs.
