
AQA Specification focus:
‘real GDP, real GDP per capita’
Economic growth and living standards are assessed through output measures such as real GDP and GDP per capita, crucial for understanding macroeconomic performance.
Understanding Output Measures
Real GDP
Real Gross Domestic Product (real GDP) is the total value of all final goods and services produced in an economy in a given period, adjusted for inflation.
Real GDP: The value of national output adjusted for changes in the price level, reflecting actual increases in the volume of production.
By adjusting for inflation, real GDP allows economists to distinguish between increases in output due to higher production versus those due to rising prices.
Real GDP = Nominal GDP ÷ Price Index × 100
Nominal GDP = GDP at current market prices
Price Index = Measure of inflation (e.g., CPI), base year = 100
An increase in real GDP indicates genuine economic growth, while a fall suggests contraction. This measure is central to government policy, as it signals economic health and productivity
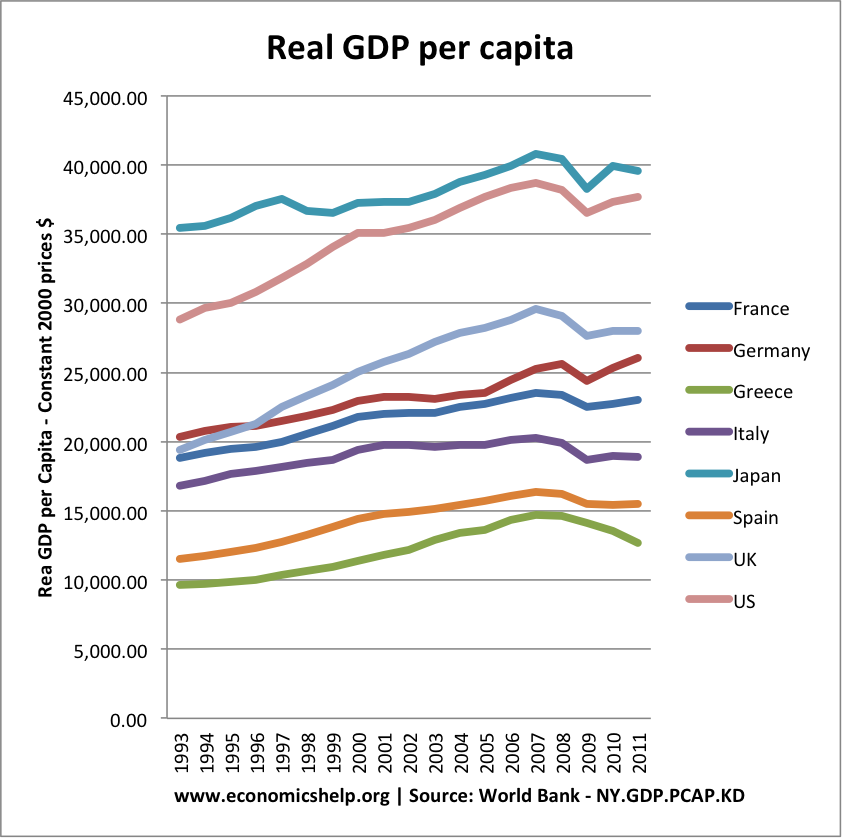
This graph compares the real GDP per capita of selected European countries and the United States from 1993 to 2011, adjusted for inflation. It highlights periods of economic growth and recession, providing a visual representation of how different economies have performed over time. Source
GDP per Capita
GDP per capita divides total GDP by the population, providing a measure of average output or income per person.
GDP per Capita: Total GDP divided by the population, used to estimate average living standards.
While real GDP shows the size of the economy, GDP per capita provides insight into individual welfare and potential consumption levels. It allows for comparisons across populations of different sizes.
Importance of Output Measures
Policy Guidance
Governments and central banks rely on real GDP and GDP per capita to:
Track economic growth over time.
Compare performance with other countries.
Assess whether living standards are rising.
Identify recessions and booms.
These indicators help shape fiscal and monetary policy, as policymakers target sustainable growth without inflationary pressure.
Measuring Living Standards
GDP per capita is often used as a proxy for living standards, but it has limitations:
It assumes an even distribution of income, which is rarely the case.
It ignores non-market activities (e.g., unpaid household work).
It excludes quality-of-life factors such as health, education, and environment.
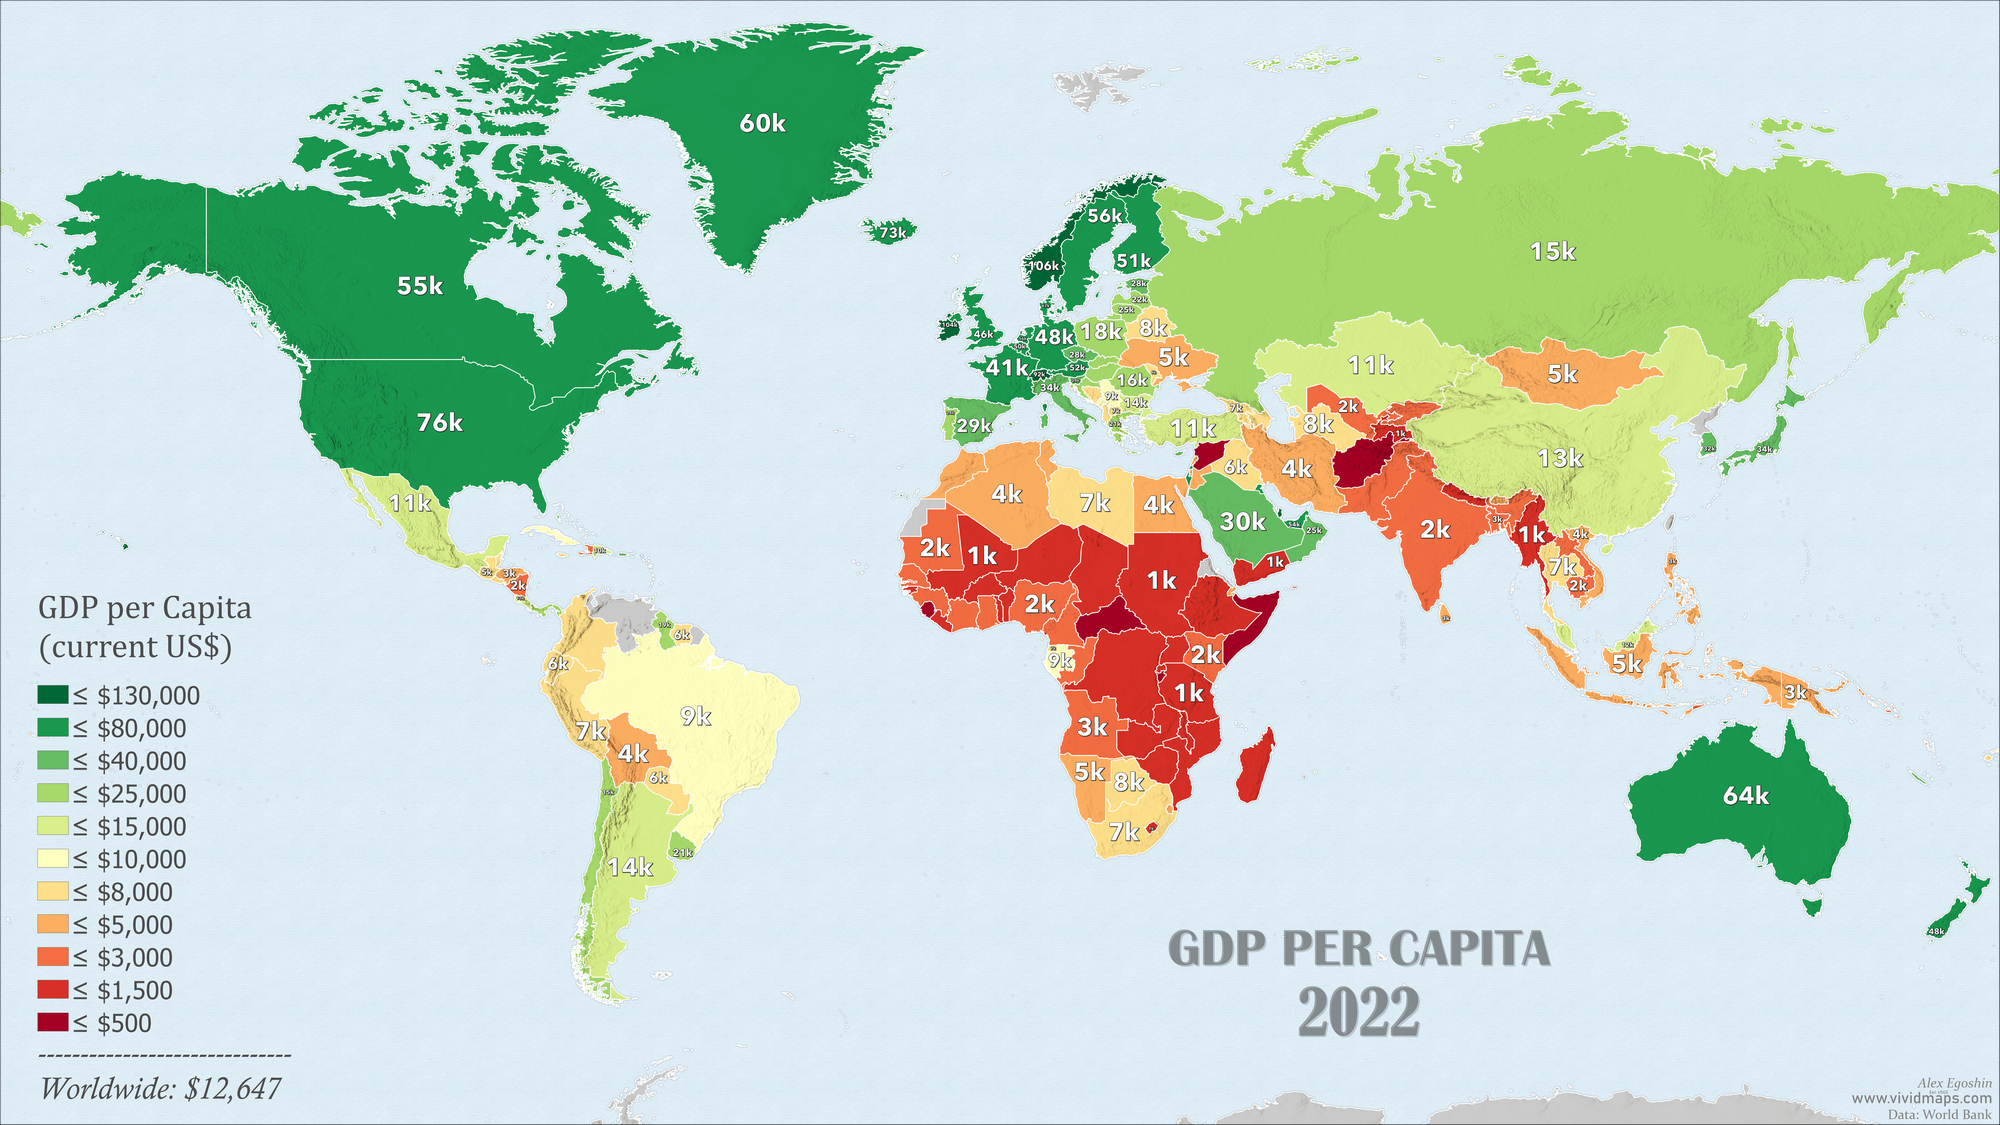
This map visualises the nominal GDP per capita by country for 2022, highlighting global economic disparities. It serves as a tool for comparing the average income levels across nations, aiding in the analysis of global economic inequality. Source
Thus, while useful, GDP per capita must be supplemented with other measures like the Human Development Index (HDI).
Strengths of Real GDP and GDP per Capita
Real GDP
Provides an inflation-adjusted measure of output, avoiding misleading growth figures.
Facilitates analysis of the business cycle by distinguishing between nominal and real growth.
Enables policymakers to set realistic targets for employment and investment.
GDP per Capita
Standardises GDP across populations, allowing for meaningful international comparisons.
Indicates whether economic growth translates into higher individual prosperity.
Useful for tracking changes in productivity per person over time.
Weaknesses of Output Measures
Real GDP
Excludes informal and shadow economy activities, leading to underestimation of actual output.
Fails to account for sustainability of growth — rapid increases may be environmentally damaging.
Treats negative outcomes, such as disaster recovery spending, as positive contributions to GDP.
GDP per Capita
Masks income inequality; average values may not reflect the majority’s experience.
Does not consider variations in cost of living across countries.
Ignores non-material aspects of welfare, such as leisure time and social cohesion.
International Comparisons
Real GDP and GDP per capita allow countries to be compared, but differences in exchange rates and price levels complicate this. Economists often use Purchasing Power Parity (PPP) adjustments to improve accuracy, though PPP is formally addressed in another subsubtopic.
Key uses of these comparisons include:
Assessing relative prosperity between developed and developing economies.
Evaluating the effectiveness of economic policy across nations.
Identifying growth potential in emerging markets.
Short-Run and Long-Run Perspectives
In the short run, changes in real GDP indicate cyclical fluctuations such as recessions or recoveries.
In the long run, sustained increases in real GDP per capita reflect rising productivity and technological progress, improving living standards.
These distinctions help economists and governments design policies tailored to immediate challenges or long-term objectives.
Linking Output Measures to Other Macroeconomic Indicators
Real GDP and GDP per capita interact closely with other economic measures:
Unemployment: Higher real GDP typically reduces unemployment as more output requires more labour.
Inflation: Rapid GDP growth may generate demand-pull inflation if output exceeds capacity.
Balance of payments: Strong growth may worsen trade balances if imports rise faster than exports.
Understanding these interactions ensures output measures are interpreted within the broader macroeconomic context.
Practice Questions
Define real GDP and explain why it is considered a better measure of economic growth than nominal GDP. (2 marks)
1 mark for definition of real GDP: value of output adjusted for inflation / shows volume of production.
1 mark for explanation: removes the effect of price changes, therefore showing genuine changes in output.
Discuss two limitations of using GDP per capita as a measure of living standards. (6 marks)
Up to 2 marks for identifying each limitation (maximum 4 marks). Examples:
Assumes even income distribution (inequality ignored).
Excludes non-market activities such as household work.
Ignores quality-of-life factors (e.g., environment, health).
Differences in cost of living between countries not reflected.
Up to 2 additional marks for development of points, e.g.:
Explaining how inequality means averages can be misleading.
Illustrating why non-material aspects are important to welfare.
Maximum 6 marks in total.
FAQ
Real GDP measures the actual value of goods and services produced, adjusted for inflation.
Potential GDP, on the other hand, reflects the maximum sustainable output an economy could produce if all resources were fully employed and used efficiently.
The difference between the two shows the output gap, indicating whether an economy is operating above or below its capacity.
Nominal GDP rises if overall prices increase, regardless of changes in actual production.
If inflation is strong, the increase in nominal GDP may simply reflect higher prices rather than higher output.
When adjusted for inflation, real GDP may show a fall if output volumes decline, even if nominal GDP appears higher.
GDP per capita depends on both total GDP and population size.
If GDP grows faster than population, GDP per capita rises.
If population grows faster than GDP, GDP per capita falls.
Migration, demographic changes, and productivity growth all influence this balance.
These dynamics affect how living standards evolve across different countries and periods.
GDP per capita averages can mask significant differences in wealth distribution.
In developing countries, a small wealthy elite may skew the average upwards, while most people remain in poverty.
Cost of living differences and informal economic activities can also distort international comparisons, making living standards appear higher or lower than they really are.
Short-term shocks, such as natural disasters, pandemics, or financial crises, often cause a sudden fall in real GDP.
This drop is magnified in GDP per capita if the population remains constant or grows.
Recovery can be uneven, with some sectors bouncing back faster than others, meaning GDP per capita may take years to return to pre-shock levels.
