
Cumulative frequency analysis is an integral part of mathematics, especially in statistics. It involves the use of cumulative frequency graphs to estimate statistical values like medians, quartiles, and percentiles. This method is invaluable in understanding the distribution and tendencies within a dataset.
Cumulative Frequency
- A running total of frequencies in a dataset.
- Helps understand data distribution and find statistical measures.
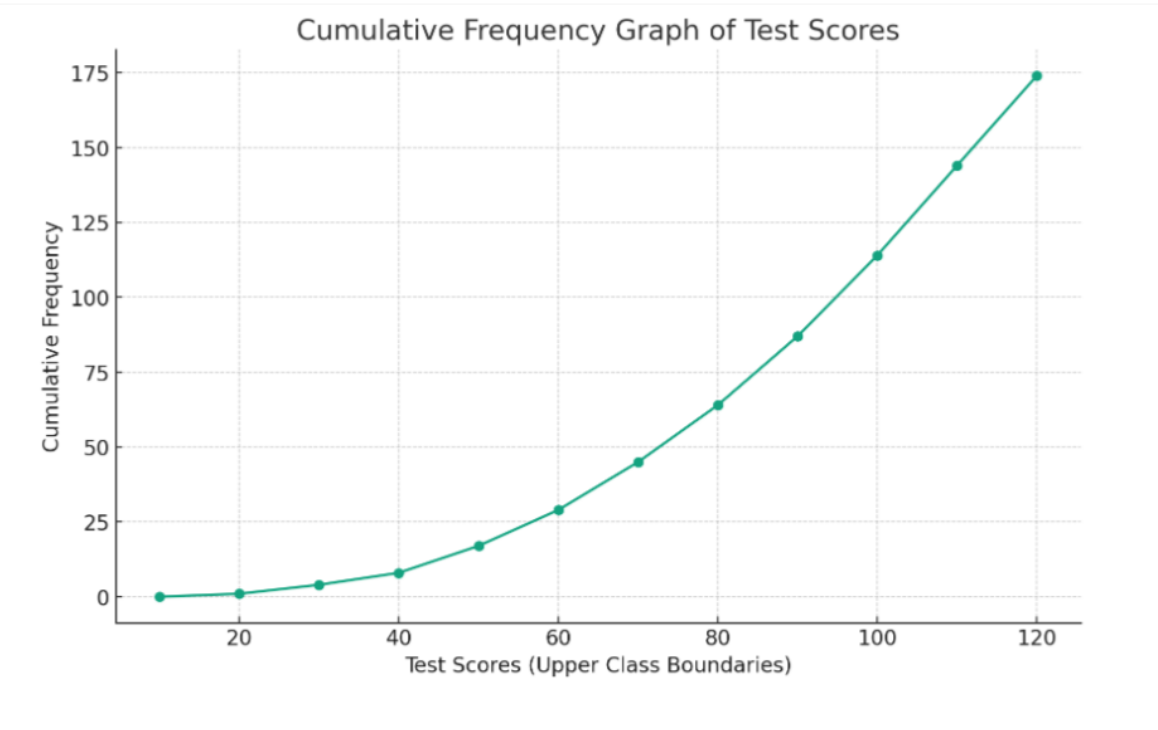
Cumulative Frequency Graphs
- Graphs showing cumulative frequency against class upper boundaries.
- X-axis: Upper boundaries of data classes (e.g., 20, 30, 40).
- Y-axis: Cumulative frequencies.
- Useful for visualizing how data accumulates.
Estimating Medians and Quartiles
- Median: Middle value of a dataset.
- Find by locating the middle position in the cumulative frequency graph.
- Quartiles: Divide data into four equal parts.
- Q1: 25th percentile (1/4th of total frequency).
- Q3: 75th percentile (3/4th of total frequency).
Understanding Percentiles
- Percentiles: Value below which a certain percentage of data falls.
- Example: 50th percentile is the median.
Creating Cumulative Frequency Graphs
1. Organize Data:
- Sort in ascending order.
- Group into classes (e.g., 10-20, 21-30).
2. Calculate Cumulative Frequencies:
- Tally scores within each interval.
- Add each class's frequency to previous totals.
3. Plot the Graph:
- Mark class upper boundaries on X-axis, cumulative frequencies on Y-axis.
- Connect points to complete the graph.
Practical Examples
Example 1: Math Test Scores of 30 Students
A class of 30 students took a maths test. The scores are given below. Estimate the median and the upper quartile.
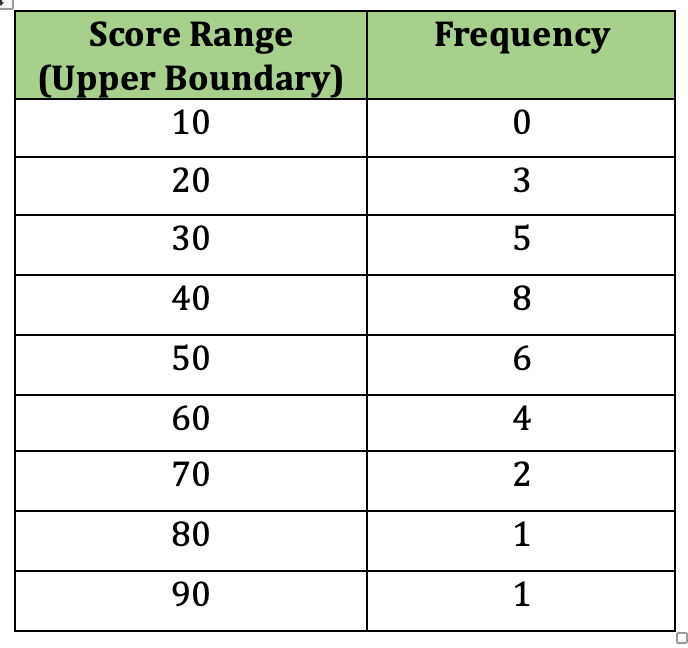
Solution:
- Calculate Cumulative Frequencies
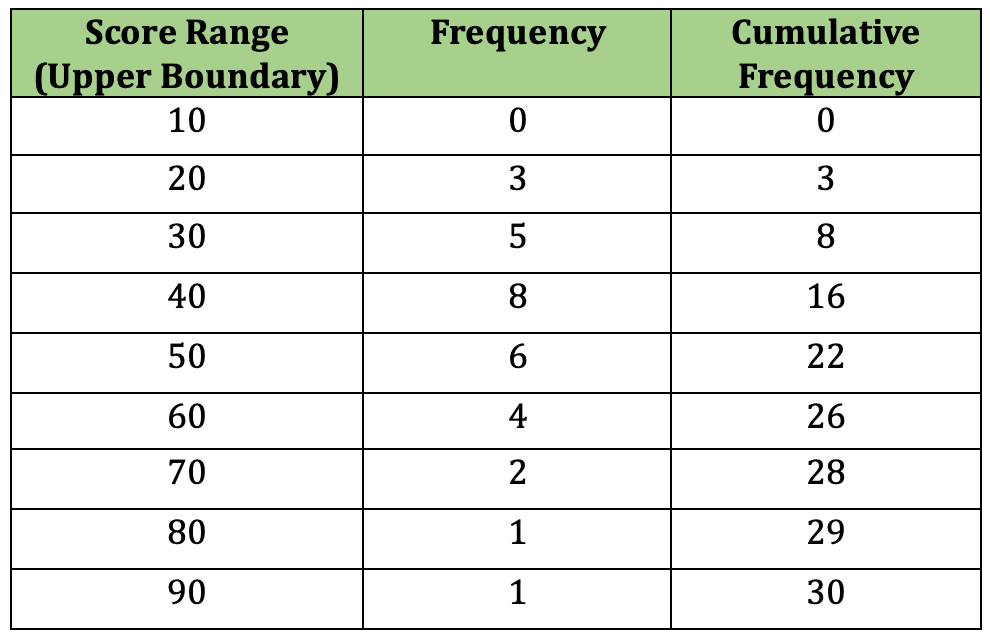
- Median Score
- Position: 15th student (Median , rounded down).
- Score: 40 (15th student's score range).
- Upper Quartile (Q3) Score
- Position: 23rd student (Q3 = , rounded).
- Score: 50 (23rd student's score range).
Example 2: Heights of 50 Students
Given the cumulative frequency graph for heights of 50 students, estimate the percentage of students taller than 170 cm.
Solution:
- Percent Taller than 170 cm
- Cumulative Frequency at 170 cm: 30 students.
- Number Taller than 170 cm: 50 (total) - 30 = 20 students.
- Percentage: .
