A solid grasp of probability distributions of discrete random variables is essential. This detailed exploration covers the creation of probability distribution tables, the calculation of expected value and variance , accompanied by practical examples. These concepts are pivotal in understanding statistical analysis and data interpretation.
Probability Distributions
- A probability distribution describes how likely different outcomes are in an experiment.
- For discrete random variables, outcomes are distinct, like countable numbers.
Discrete Random Variables
- These variables take specific values, often whole numbers.
- Examples: Number of correct answers on a test, number of heads in coin flips.
Probability Distribution Tables
- These tables show probabilities for each outcome of a discrete random variable.
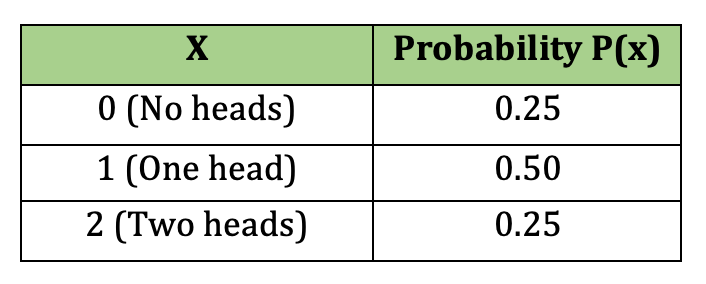
Example: Coin Toss
- Experiment: Tossing a fair coin twice.
- Random variable X = number of heads.
- Possible X values: 0, 1, 2.
- Each outcome (head or tail) is equally likely.
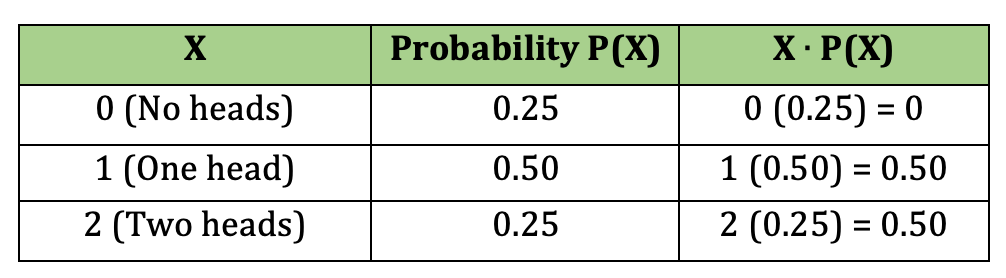
Expected Value (E(X))
- Represents the 'average' outcome of a random variable.
- Calculated as: E(X) = Sum of [x * P(x)].
- Example: Coin Toss, E(X) = 0 0.25 + 1 0.50 + 2 * 0.25 = 1.
- In two coin tosses, expect 1 head on average.
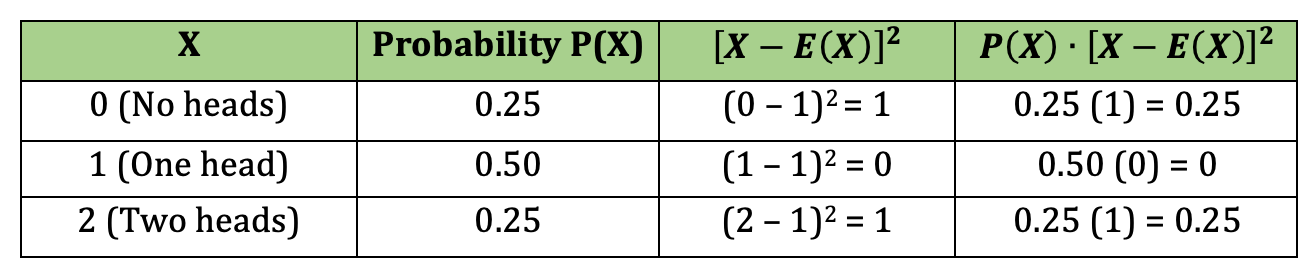
Variance (Var(X))
- Measures how spread out the data is.
- Calculated as: .
- Example: Coin Toss, .
- Variance for number of heads in two tosses is 0.5.