CIE Syllabus focus:
'Interpret or recall plots of first ionisation energy against atomic number for Period 2 and Period 3 elements, explaining the overall trends and significant deviations.'
Plots of first ionization energy across Periods 2 and 3 show a clear overall rise, but the graphs are not perfectly smooth. The dips in specific places are important evidence about electron arrangement.
First ionization energy: The energy required to remove one electron from each atom in one mole of gaseous atoms to form one mole of gaseous ions.
When explaining any point on the graph, connect the visible pattern to the electron being removed and the forces acting on it.
Shape of the plots
A plot of first ionization energy against atomic number for Period 2 or Period 3 has a similar overall pattern:
it starts at a relatively low value
it rises across the period
it reaches a maximum at the noble gas
it contains small deviations from the steady increase
For Period 2, the elements are Li to Ne.
For Period 3, the elements are Na to Ar.
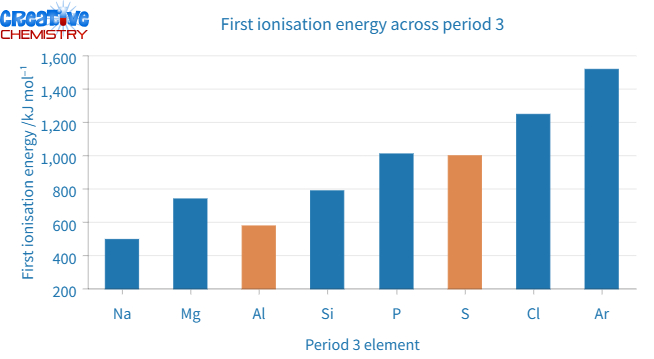
First ionisation energy across Period 3 (Na to Ar), plotted against atomic number. The overall upward trend is visible, with the characteristic deviations at Al (electron removed from a higher-energy subshell than ) and at S (electron–electron repulsion from a paired electron). Source
The graph is not a straight line because the outer electron is not always removed from an identical type of orbital. Changes in subshell and changes in electron pairing produce local drops.
If you compare the two periods, the pattern of rises and dips is similar. However, the absolute first ionization energies in Period 3 are generally lower than the equivalent values in Period 2 because the outer electrons in Period 3 are farther from the nucleus and experience more shielding.
Why the overall trend rises across a period
Across each period, proton number increases. This means the nucleus has a greater positive charge.
At the same time:
electrons are being added to the same main shell
shielding does not increase very much across the period
atomic radius decreases slightly
attraction between the nucleus and the outer electron becomes stronger
As a result, more energy is needed to remove the outer electron, so the first ionization energy generally increases.
This is the main explanation for the upward trend in both Period 2 and Period 3. In exam answers, it is best to state all parts of the reasoning clearly:
greater nuclear charge
similar shielding
smaller radius or stronger attraction
therefore more energy required
A common mistake is to say only that there are “more protons.” That is not enough unless you link it to the stronger attraction for the electron being removed.
Significant deviations in Period 2
There are two important dips in Period 2 that students must be able to explain.
The dip from Be to B
The first ionization energy of B is lower than that of Be, even though B has one more proton.
This happens because:
in Be, the electron removed is from a 2s subshell
in B, the electron removed is from a 2p subshell
a 2p electron is at slightly higher energy than a 2s electron
it is also slightly farther from the nucleus on average
so it is easier to remove
Therefore, the move from Be to B produces a drop in first ionization energy.
The key idea is that the overall increase across the period is interrupted when the electron removed comes from a higher-energy subshell.
The dip from N to O
The first ionization energy of O is lower than that of N.
This is because:
N has three electrons occupying the three 2p orbitals singly
O has four electrons in the 2p subshell
in O, one of the 2p orbitals contains a pair of electrons
repulsion between paired electrons makes one of them easier to remove
So, although O has a higher nuclear charge than N, the extra electron-electron repulsion in the paired orbital lowers the energy needed to remove an electron.
This dip is evidence that electrons occupy orbitals singly before pairing, and that paired electrons repel each other.
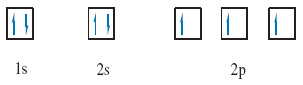
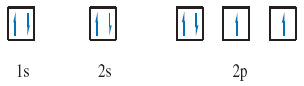
Orbital box diagrams for N and O showing how the three orbitals fill according to Hund’s rule. Nitrogen has three unpaired electrons (one in each orbital), whereas oxygen has one paired set in a orbital, increasing electron–electron repulsion and lowering the first ionisation energy for O. Source
Significant deviations in Period 3
Period 3 shows the same type of pattern as Period 2.
The dip from Mg to Al
The first ionization energy of Al is lower than that of Mg.
The explanation matches the Be to B pattern:
Mg loses an electron from a 3s subshell
Al loses an electron from a 3p subshell
a 3p electron is higher in energy than a 3s electron
it is therefore easier to remove
So the graph dips from Mg to Al instead of continuing to rise smoothly.
The dip from P to S
The first ionization energy of S is lower than that of P.
The explanation matches the N to O pattern:
P has three electrons in the 3p subshell, occupying separate orbitals
S has four electrons in the 3p subshell
one 3p orbital in S contains a paired set of electrons
repulsion within that pair makes removal easier
This extra repulsion slightly reduces the first ionization energy of S.
Interpreting exam plots accurately
When you are asked to interpret or recall a plot, focus on the shape as well as the reasons.
Useful points to state are:
there is an overall increase across each period
the increase is due to increasing nuclear charge
shielding remains roughly similar across the period
there is a dip after Group 2
there is another dip after Group 15
For Period 2, the important deviations are:
Be to B
N to O
For Period 3, the important deviations are:
Mg to Al
P to S
Avoid vague phrases such as “the pattern is irregular.” The deviations are not random. They occur for clear structural reasons:
change from s to p subshell
pairing of electrons in a p orbital
In high-mark answers, precise language matters. Use terms like nuclear charge, shielding, subshell, orbital, electron repulsion, and easier to remove.
Practice Questions
The first ionization energy generally increases across Period 3, but there are two significant deviations.
State the two elements in Period 3 that have a lower first ionization energy than expected from the overall trend. [2 marks]
Al [1]
S [1]
Explain the overall trend in first ionization energy across Period 2 and account for the significant deviations in the plot. [6 marks]
First ionization energy generally increases across Period 2 [1]
Nuclear charge increases across the period / number of protons increases [1]
Electrons are added to the same main shell / shielding changes very little [1]
Attraction between nucleus and outer electron increases / atomic radius decreases, so more energy is needed to remove the electron [1]
B has a lower first ionization energy than Be because the electron removed from B is from a 2p subshell, which is higher in energy / easier to remove than a 2s electron [1]
O has a lower first ionization energy than N because O has a paired electron in a 2p orbital, and electron-electron repulsion makes it easier to remove [1]
FAQ
The points rise overall, but small drops interrupt the increase at predictable positions.
These drops happen because:
the electron removed may come from a higher-energy subshell
a paired electron may experience extra repulsion
A smooth line would suggest only one factor controls ionization energy, but the graph shows that electron arrangement inside the shell also matters.
Argon has more protons, but its outer electron is in a higher shell.
That means the outer electron in argon is:
farther from the nucleus
more shielded by inner electrons
These two factors outweigh the increased nuclear charge, so less energy is needed to remove argon’s outer electron than neon’s.
Sulfur does have extra repulsion from a paired 3p electron, so its first ionization energy drops below phosphorus.
However, sulfur also has:
a higher nuclear charge than phosphorus
a stronger attraction between nucleus and electrons
So two effects are competing. The repulsion lowers the value, but the greater nuclear charge prevents the drop from being very large.
A line plot helps show the overall pattern across increasing atomic number.
It makes it easier to see:
the general rise across a period
the positions of the dips
the similarity between Period 2 and Period 3
Still, each point represents a separate element. The connecting line is a visual aid, not evidence of values between the elements.
Very small numerical differences can vary slightly depending on rounding, but the main pattern does not change.
For exam purposes, the key features remain the same:
overall increase across each period
dip after Group 2
dip after Group 15
So even if exact numbers differ a little between sources, the interpretation of the plot stays unchanged.