CIE Syllabus focus:
'Use and compare data on electronic configurations, atomic radii, melting and boiling temperatures, and first ionisation energies to illustrate periodicity across different periods.'
Periodicity is most convincing when real data are compared across more than one period. Looking at several properties together shows that the same overall patterns repeat, even when the actual values are different.
Using data to recognize periodicity
To illustrate periodicity, you should compare how a property changes across one period and then check whether a similar pattern appears in the next period. The strongest comparisons are usually made between Period 2 and Period 3.
When interpreting data, focus on:
the overall trend across a period
where the pattern restarts at the next period
whether similar features appear in the same group positions
whether the pattern repeats even if the numerical values are not identical
Electronic configuration data
Electronic configurations provide the clearest framework for periodicity because they show how outer-shell electrons change across a period.
Across Period 2:
Li has 1 outer electron
Be has 2
B has 3
C has 4
N has 5
O has 6
F has 7
Ne has 8
Across Period 3, the same outer-shell pattern is repeated:
Na has 1 outer electron
Mg has 2
Al has 3
Si has 4
P has 5
S has 6
Cl has 7
Ar has 8
This repeated sequence is a direct illustration of periodicity. Elements in the same group in different periods have the same number of outer-shell electrons, so their data often show similar positions in trends.
The key point is that the electron pattern does not continue indefinitely across the table.
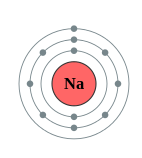
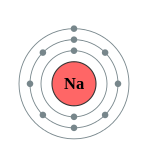
Shell diagrams for Li and Na show the same valence-electron situation (one outer electron) occurring in different periods. The key difference is the extra occupied shell in sodium, which helps explain why absolute values (e.g., radii and ionisation energies) change even when group patterns repeat. Source
It builds across a period and then starts again at the next one, but with an extra occupied shell.
Atomic radius data
Atomic radius data also show a repeated pattern.
Across a period, atomic radius generally decreases from left to right. This is because the nuclear charge increases while electrons are being added to the same main shell, so the outer electrons are pulled closer to the nucleus.
When you move from the end of one period to the start of the next:
the atomic radius increases suddenly
a new shell has begun
the pattern of decreasing radius then repeats across the new period
So, if radius data are plotted against atomic number, the graph shows a fall across one period, then a jump up at the start of the next, followed by another fall. That repeated shape illustrates periodicity clearly.
Comparing periods also shows that atoms in Period 3 are generally larger than those in Period 2 because they have one more occupied shell. The absolute values change, but the trend within each period is similar.
First ionization energy data
Data for first ionization energy show one of the most useful periodic patterns.
Across a period, first ionization energy generally increases. As atomic radius decreases and nuclear attraction for the outer electron becomes stronger, more energy is needed to remove that electron.
When the next period begins:
first ionization energy drops sharply
the outer electron is now in a higher shell
shielding increases
the electron is farther from the nucleus
This produces a repeated pattern across successive periods:
a general rise across the period
a fall at the start of the next one
then another rise
The pattern is not perfectly smooth.
Small dips occur at particular points, and these also repeat in equivalent positions from one period to the next. That makes the data especially powerful evidence for periodicity, because both the general trend and the smaller features are repeated.
So, ionization energy data show more than a simple increase. They show a recurring pattern of increases and small deviations linked to recurring electronic structures.
Melting and boiling temperature data
Melting and boiling temperature data also illustrate periodicity, but the pattern is less simple than for radius or ionization energy.
Across both Period 2 and Period 3:
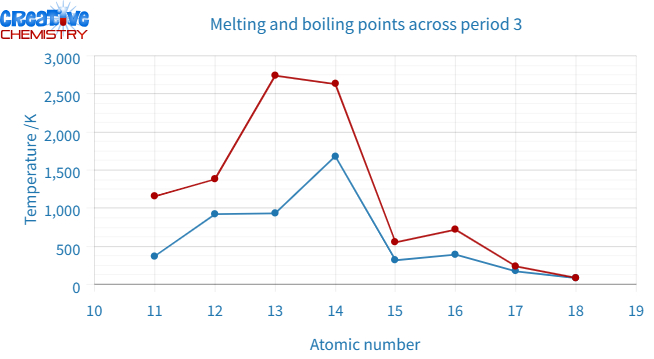
A melting-point and boiling-point plot across Period 3 shows temperatures rising from Na through to a maximum near Si, then dropping sharply across the molecular non-metals to Ar. This visual summary helps connect the periodic trend shape to changes in structure and bonding type across the period (metallic → giant covalent → simple molecular/monatomic). Source
temperatures rise from the elements on the left to a maximum near the middle of the period
they then fall strongly toward the right-hand side
the noble gases have very low values
This means that if the data are plotted, both periods show a broadly similar shape. The exact values are different, but the pattern repeats.
These repeated changes happen because the type of structure present across a period changes. The important point for periodicity is not memorizing every value, but recognizing that the thermal data follow a similar sequence in different periods.
When comparing the two periods:
the position of high and low values is similar
the trend shape is similar
the actual temperatures may differ because the particles and structures are not identical
This is a good reminder that periodicity is about a repeating pattern, not about every element having the same value as the one above or below it.
Comparing datasets across periods
The best way to use data to illustrate periodicity is to compare several properties together rather than studying each one in isolation.
Electronic configuration data explain why the other properties repeat:
the outer-shell pattern repeats from one period to the next
the start of a new period means a new shell is occupied
elements in the same group have matching outer-electron patterns
Atomic radius data support this by showing:
a decrease across each period
a jump to a larger value at the next period
the same overall pattern repeated
First ionization energy data support it by showing:
a general increase across each period
a drop at the start of the next period
repeated smaller deviations in similar positions
Melting and boiling temperature data support it by showing:
similar broad shapes across different periods
maxima and minima in corresponding parts of each period
repeated changes linked to recurring patterns in elemental structure
In exam questions, periodicity should be shown by referring to repetition of trends across different periods, not just by describing one period on its own. Comparing several datasets at once makes the repeated nature of the Periodic Table much easier to see.
Practice Questions
The electronic configurations of elements in Period 2 go from one outer electron in lithium to eight outer electrons in neon.
The electronic configurations of elements in Period 3 go from one outer electron in sodium to eight outer electrons in argon.
State one similarity and one difference in these data that illustrate periodicity. (2 marks)
Similarity: both periods show the outer-shell electron number increasing from 1 to 8 across the period. (1)
Difference: Period 3 atoms have one more occupied shell than Period 2 atoms / the pattern restarts in a new shell at the beginning of Period 3. (1)
A student compares data for Period 2 and Period 3 and notices these trends:
atomic radius decreases across each period
first ionization energy generally increases across each period
melting temperatures rise to a maximum near the middle of each period and then fall
the pattern begins again in the next period
Explain how these data together illustrate periodicity. (6 marks)
Periodicity means a repeating pattern in properties from one period to the next. (1)
Electronic configurations repeat in terms of outer-shell electrons across each period. (1)
Atomic radius decreases across a period because increasing nuclear charge pulls electrons closer while they are added to the same shell. (1)
Atomic radius increases again at the start of the next period because a new shell is occupied. (1)
First ionization energy generally increases across a period because the outer electron is more strongly attracted to the nucleus. (1)
Melting temperature data also show a repeated overall pattern across both periods, with similar positions of high and low values even though the exact temperatures differ. (1)
FAQ
A graph makes the repeated shape of the trend easier to see.
For example:
atomic radius gives repeated downward slopes
first ionization energy gives repeated upward trends with small dips
melting temperature gives repeated peaks and falls
A raw data list can hide those patterns, especially when the numerical values in different periods are not close together.
Periodicity is about the recurrence of behavior, not about matching numbers.
For instance, an element in Period 3 does not need to have the same atomic radius or melting temperature as the corresponding element in Period 2. What matters is that the property changes across the period in a similar way and restarts in the next period.
That is why trend shape is often more important than individual values.
Yes. Small irregularities can actually strengthen the case for periodicity if they recur in similar positions.
If a graph shows a slight dip at one point in Period 2 and a similar dip in the corresponding part of Period 3, that suggests the same underlying electronic arrangement is influencing both periods.
Repeated exceptions are often just as informative as repeated general trends.
Atomic radius and first ionization energy are especially useful here.
A new period is often shown by:
a sudden increase in atomic radius
a marked drop in first ionization energy
Both changes happen because the outer electron has moved into a higher main shell. That creates a very noticeable break between the end of one period and the start of the next.
One property can sometimes be misleading if viewed alone.
Using several datasets allows you to cross-check the pattern:
electronic configurations show the repeating outer-shell sequence
radius data show shell effects
ionization energy shows changes in attraction to the nucleus
melting and boiling data show repeating physical behavior
When all of them point to a repeated pattern, the evidence for periodicity becomes much stronger.